Showing posts with label Gross Domestic Product (GDP). Show all posts

Monday, September 8, 2014

No Economy For Americans

Paul Craig Roberts

The Dow Jones stock average closed Friday at 17,137, despite the fact that the payroll jobs report was a measly 125,000 new jobs for August, an insufficient amount to keep up with the growth in the working age population.

The low 125,000 jobs figure is also inconsistent with the Bureau of Economic Analysis’ second estimate of second quarter 2014 US GDP growth of 4.2 percent–a figure beyond the capability of the present-day US economy.

Clearly, the economic numbers are out of sync with one another. They are also out of sync with reality.

One of the reasons the stock market average is high is the massive liquidity the Federal Reserve has pumped into the banking system since 2008. Instead of going into consumer inflation, the money went into stock and bond price inflation.

Another reason for the artificial high stock market is the multi-trillion dollar buy-back of their own stock by US corporations. Many of these corporations have even borrowed from the banks in order to drive up their share prices with heavy purchases, thus maximizing executive bonuses and the values of stock options for board members. In effect, they are looting their own firms by loading the companies with debt in order to drive up executive and board incomes.
The stock market’s rise is not because consumer incomes and real retail sales are growing. Real family median incomes have been falling, and real retail sales, at best, are flat.

Let’s look at the composition of the pathetic 125,000 new jobs, and then we will examine whether these jobs are real or make-believe. (Keep in mind that payroll jobs include part-time jobs and that the number of payroll jobs is not the number of people employed, because many Americans make ends meet by working two and even three jobs.)

As I have reported for many years, the US economy no longer is capable of creating goods producing jobs. The Bureau of Labor Statistics August payroll jobs report shows zero manufacturing jobs. I read the other day that the US now has four or five times more people on food stamps than in manufacturing jobs.
The jobs of the New Economy are in lowly paid, nontradable domestic services–the jobs that characterize a Third World Economy.

Perhaps reflecting the collapse of retail sales, retail trade lost 8,400 jobs in August.

“Professional and business services” accounted for 47,000 or 38% of August’s new jobs. Of these 47,000 new jobs, 49% consisted of “administrative and waste services,” largely temporary help services.

“Health care and social assistance” accounted for 42,700 or 34% of the new jobs of which 53% consists of “ambulatory health care services.”
Waitresses and bartenders accounted for 21,100 or 17% of the new jobs.

There were 8,000 new government jobs or 6% of the 125,000 new jobs.

That’s it. That is the job picture of “the world’s only superpower,” “the world’s largest economy,” “the world’s richest people.” It is the picture of employment in a Third World country.

And now for the real question: Are those 125,000 new jobs really there, or are they a statistical mirage? Statistician John Williams (shadowstats.com) says the jobs are a mirage produced by “the changing seasonal adjustments within the concurrent-seasonal adjustment process used by the Bureau of Labor Statistics” and by the birth/death model, which assumes that many more unreported new jobs are created each month by new start-up businesses than are lost from unreported business closings. Williams says that without the gimmicks used by BLS to create jobs that are not there, the actual change in August payrolls “was a solid contraction in excess of 125,000 jobs.” In other words, the economy did not gain 125,000 jobs. It lost 125,000 jobs.

Beginning with the Clinton regime, the American economy has only worked for the One Percent, and it only works for them because the government makes the 99 percent bail out the One Percent. The American economy is an Aristocratic Economy that works for the government-privileged few, but not for anyone else. To understand this hard fact, read Nomi Prins book, All The Presidents’ Bankers.

Of course, the real figures are more like the Ten Percent and the 90 percent. The One Percent caught on, because the upper reaches of that one percent are all multi-billionaires with more money than a family could spend in multiple lifetimes.

The time has passed when American corporations had a sense of social responsibility. Two distinguished Americans writing in Daedalus, one of the few remaining publications not (yet) under corporate control, show that US corporations have become socially dysfunctional because they only serve shareholders and executives.

Historically in the US, corporations had responsibilities to their customers, employees, communities, and owners. In recent years this has been changed. Today corporations only have responsibilities to their shareholders. If profits go up, executives receive performance bonuses for serving shareholders.

Reducing executive success to one indicator has has enormous negative consequences for everyone else. Americans are suffering in many ways. Their jobs, both manufacturing and professional tradable services such as software engineering, have been moved offshore and given to foreigners. Americans have been deprived of interest income so that the former bank officials in charge of the US government can save the banks that deregulation permitted to over leverage with debt and risk.

The costs of customer service has been shifted to customers who lose large amounts of time waiting to connect with a live person who can correct the mistake the company has made. The unleashing of greed as the only business virtue and pressure from Wall Street for greater profits has caused many service providers, such as telephone and Internet, to forego maintenance and upgrade of facilities in order to hold down costs and boost profits. My telephone ceased to work on September 3, and my service provider lacks sufficient work crews to repair my line prior to the evening of September 8. Last year my Internet provider could not reestablish my Internet service for 10 days. If you call about a bill or a service problem, the companies keep you on the line forever awaiting a real person while they try to sell you new services even though the ones you have purchased don’t work.

Sufficient service crews to provide satisfaction for customers means higher costs, less profits, less shareholder earnings and less performance bonuses for managers. Guess who pays the price for the large rewards to owners and managers–the customers.

I remember the days of AT&T, a regulated monopoly. Everything worked. Any problem was fixed within two hours, barring a major catastrophe such as a hurricane or tornado. The telephone was answered no later than the third ring by a real person, not a voice recording, and the person who answered could fix any problem. There was no menu of a half dozen or dozen from which to select and to wait another quarter hour while being given sales pitches.

Profits made by imposing costs on customers are not legitimate profits.
Profits made by
relocating American jobs offshore are not legitimate profits. Profits achieved by bailouts of managerial mistakes by taxpayers who provide the bailout funds but don’t share in the bonuses are not legitimate profits.

Profits achieved by monopoly concentration, as now exists in the financial “services” industry, are not legitimate profits.

In America, franchises, chains, and big-box stores have destroyed a wide array of independent and family businesses that allowed enterprising Americans an independent existence.

Deregulated free-market America has created an economy that serves only the few, which explains the extraordinary concentration in the 21st century of income and wealth in fewer and fewer hands–another defining characteristic of a Third World country.

American capitalism has failed. It can no longer produce jobs for the work force, and its
profits come from its political ability to impose costs on the American population.

Monday, August 4, 2014

Defining Away Economic Failure

Paul Craig Roberts

Last week’s government guesstimate that second quarter 2014 real GDP growth will be 4% seems nonsensical on its face. There is no evidence of increases in real median family incomes or real consumer credit that would lift the economy from a first quarter decline to 4% growth in the second quarter. Middle class store closings (Sears, Macy’s, J.C. Penney) have spread into the Dollar stores used by those with lower incomes. Family Dollar, a chain in the process of closing hundreds of stores is being bought by Dollar Tree, the only one of the three Dollar store chains that is not in trouble. Wal-Mart’s sales have declined for the past 5 quarters. Declining sales and retail store closings indicate shrinking consumer purchasing power. Retail facts do not support the claim of a 4% GDP growth rate for the second quarter, and they do not support last Friday’s payroll job claim of 26,700 new retail jobs in July.

What about the housing market? Don’t the headlines accompanying last Friday’s payroll jobs report, such as “Hiring Settles Into Steady Gains,” mean more people working and a boost to the economy from a housing recovery? No. What the financial press did not report is that the US is in a structural jobs depression. In the 12-month period from July 2013 through July 2014, 2.3 million Americans of working age were added to the population. Of these 2.3 million only 330 thousand entered the labor force. My interpretation of this is that the job market is so poor that only 14% of the increase in the working age population entered the labor force.

The decline in the labor force participation rate is bad news for the housing market. The US labor force participation rate peaked at 67.3% in 2000 and has been in a sustained downturn ever since. The rate of decline increased in October 2008 with the bank bailout and Quantitative Easing. From October 2008 to the present, 13.2 million Americans were added to the working age population, but only 818 thousand, or 6%, entered the labor force.  Despite government and financial press claims, the Federal Reserve’s multi-year policy of printing money with which to purchase bonds did not restore the housing or job markets.

What about the stock market? It has been down in recent days but is still high historically. Isn’t the stock market evidence of a good economy? Not if stocks are up because corporations are buying back their own stock. Corporations are now the largest buyers of stocks. Recently we learned that from 2006 through 2013 corporations authorized $4.14 trillion in buybacks of their publicly traded stocks. Moreover, it appears that corporations have been borrowing the money from banks with which to buy back their stocks. Last year there were $754.8 billion in authorized stock buybacks and $782.5 billion in corporate borrowing. In the first three months of this year, companies purchased $160 billion of their own stocks.

Borrowing to buyback stock leaves a company with debt but without new investment with which to produce revenues to service the debt. The massive stock buybacks demonstrate that American capitalism is now corrupt. In order to maximize personal short-term financial benefits flowing from bonuses, stock options, and capital gains, CEOs, boards of directors, and shareholders are decapitalizing public companies and loading them up with debt.

Well, isn’t the economy being helped by the return of manufacturing to America? Apparently not. Data for 1999-2012 indicate that the offshoring of manufacturing increased by 9%.

One economist, Susan Hester, an economist for the Retail Industry Leaders Association, has decided to turn the loss of manufacturing jobs into a virtue. Her argument is that retail employment dwarfs manufacturing employment and that more American jobs can be created by selling more imports than by encouraging manufacturing in order to provide exports.

According to Ms. Hester’s research, the US makes more money from the retail side than from the production side. She concludes that the value added to a product by offshore labor is a small percentage of the value added by “managing offshored production, handling Customs clearances, managing warehouses and distribution, marketing apparel products, and by millions of people in the retail sector stocking shelves and working cash registers.”

In other words, the US manufacturing jobs moved offshore are just a throwaway. The money is made in selling the imports.

Ms. Hester neglects to recognize that when offshored production is brought to the US to be marketed, it comes in as imports and results in a larger US trade deficit. Foreigners use dollars paid to them for the products that they make for US firms to purchase ownership of US bonds, stocks, and real assets such as land, buildings, and companies. Consequently, interest, profits, capital gains, and rents associated with the foreign purchases of US assets now flow to foreigners and not to Americans. The current account worsens.

It works like this: The excess of US imports over US exports leaves foreigners with claims on US income and wealth that are settled by foreign purchases of US assets. The income produced by these assets now flows abroad with the consequence that income earned by foreigners on their US investments exceeds the income earned by the US on its foreign investments.

According to Ms. Hester’s reasoning, Americans would be better off it they produced nothing that they need and in place of manufacturing relied on the incomes of US fashion designers and pattern makers who specify the offshored production for US markets, on the compliance officers and freight agents, on production planning and expediting clerks, and on longshore workers and railroad employees who deliver the foreign-made goods to US consumer markets.

Ms. Hester believes that the value-added by offshored manufacturing is inconsequential. How then did China get rich from it, becoming the second largest economy and employing 100 million people in manufacturing (compared to America’s 12 million), and acquire the largest foreign reserves of any country?

After Ms. Hester answers that question she can explain why US corporations go to the trouble to offshore their manufacturing if the contribution to value-added is so low? The value added is obviously substantial enough for the labor cost savings to pay for transportation costs to the US from Asia, for the cost of set-up and management of foreign based facilities, and for the cost of the adverse publicity from abandoning US communities for Asia and still leave value-added after all costs to enlarge profits and drive up stock prices and executive bonuses.

Ms. Hester fools herself. The low value that she calculates Chinese, Indian, or Vietnamese labor adds to the price of a shirt reflects the low foreign labor cost, not a low value of the shirt in US markets or a low value of an iPhone in European markets. Marketing, warehousing and distribution are done in the US by more highly paid people, and this is why it looks like the value added comes from sources other than manufacturing. Ms. Hester overlooks that the lower cost of foreign labor does not translate into a less valued product but into higher profits.

Economists assume that the labor cost savings are passed on to the consumers in lower prices, but I have not experienced declining prices of Nike and Merrell sports shoes, of sheets and towels, of Brooks Brothers and Ralph Lauren shirts, of Apple computers, or whatever as a result of moving US production offshore. The labor cost savings go into profits, managerial bonuses, and capital gains for shareholders and is one reason for the extraordinary increase in income and wealth inequality in the US.

Focused on short-term profit, manufacturers and retailers are destroying the US consumer market. The average annual salary of a US apparel manufacturing worker is $35,000. The average salary of US retail employees is less than half of that amount and provides no discretionary income with which to boost consumer spending in retail stores.

The American corporate practice of offshoring manufacturing has made it impossible for the Obama regime to keep its promises of creating manufacturing jobs and exports. Unable to create real jobs and real exports, the US government has proposed to create virtual jobs and virtual exports made by “factoryless goods producers.” In order to keep his promise of doubling the growth of US exports, the Obama regime wants to redefine foreign output as US output.

A “factoryless goods producer” is a newly invented statistical category. It is a company like Nike or Apple that outsources the production of its products to foreign companies. The Obama regime is proposing to redefine companies such as Apple that own a brand name or a product design as manufacturing companies even though the companies do not manufacture.

In other words, whether or not a US company is a manufacturer does not depend on its activity, but on its ownership of a brand name made for the company by a foreign manufacturer. For example, Apple iPhones made in China and sold in Europe would be reported as US exports of manufactured goods, and iPhones sold in the US would no longer be classified as imports but as US manufacturing output. Apple’s non-manufacturing employees would be transformed into manufacturing employment.

Clearly, the purpose of this statistical deception is to inflate the number of US manufacturing jobs, US manufacturing output, and US exports and to convert imports into domestic production. It is a scheme that eliminates the large US trade deficit by redefinition.

The reclassification would leave the government’s Office of Statistical Lies with the anomaly that products made in China, India, Indonesia or wherever become US GDP as long as the brand name is owned by a US corporation, but the payments to the Asian workers who produced the products remain as claims on US wealth and can be converted into ownership of US bonds, companies, and real estate.

For example, Chinese workers produced the Apple products, and China has the claims on US wealth to prove it. How are these claims accounted for statistically by the Obama regime’s redefinition? The US can add China’s production of the Apple products to US GDP, but how does the US deduct the Chinese-produced Apple products from China’s GDP? And how does the Obama regime’s redefinition get rid of the payments by Apple to the Chinese labor that produced the products? These payments comprise claims on US wealth.

In other words, the reclassification would double count the output of Apple’s products. If every country does this, world GDP will rise statistically regardless of the fact that no more goods and services are produced. Perhaps this is the way to define away world poverty.

“Factoryless goods producers” was foreshadowed by Harvard professor Michael Porter’s 2006 competitiveness report, a justification for jobs offshoring. Defending jobs offshoring, Porter downplayed the rise in the US trade deficit and decline in the US GDP growth rate caused by jobs offshoring. Porter argued, in effect, that ownership of the revenues and products, not the location in which the revenues and products are produced, should determine their classification. As I pointed out in my critique (see The Failure of Laissez Faire Capitalism and Economic Dissolution of the West), the result would be to raise US GDP by the amount of US production outsourced abroad and by the output of US overseas subsidiaries and to decrease the GDP of the countries in which the manufacturing actually takes place. Consistency would require that the German and Japanese autos, for example, that are produced in the US with US labor would become deductions from US GDP and be reported as German and Japanese GDP.

As I have emphasized for years, the West already lives in the dystopia forecast by George Orwell.


Jobs are created by hypothetical add-ons to the reported payroll figures and by inappropriate use of seasonal adjustments. Inflation is erased by substituting lower priced items in the inflation index for those that rise in price and by redefining rising prices as quality improvements. Real GDP growth is magicked into existence by deflating nominal GDP with the understated measure of inflation. Now corporations without factories are going to produce US manufacturing output, US exports, and US manufacturing jobs!

Every sphere of Western existence is defined by propaganda. Consequently, we have reached a perfect state of nihilism. We can believe nothing that we are told by government, corporations, and the presstitute media.

We live in a lie, and the lie is ever expanding.

Thursday, July 10, 2014

The Deteriorating Economic Outlook

July 8, 2014

Paul Craig Roberts, Dave Kranzler, and John Williams

The third and final estimate (until the annual GDP revisions) of first quarter 2014 real GDP growth released June 25 by the US Bureau of Economic Analysis was a 2.9% contraction in GDP growth, a 5.5 percentage point difference from the January forecast of 2.6% growth. Apparently, the first quarter contraction was dismissed by those speculating in equities as weather related, as stock averages rose with the bad news.

Stock market participants might be in for a second quarter surprise. The result of many years of changes made to the official inflation measures is a substantially understated inflation rate. John Williams (www.shadowstats.com) provides inflation estimates based on previous official methodology when the Consumer Price Index still represented the cost of a constant standard of living. The 1.26% inflation measure used to deflate first quarter nominal GDP is unrealistic, as Americans who make purchases are aware.

A reasonable correction to the understated deflator gives a much higher first quarter contraction. The two main causes of inflation’s understatement are the substitution principle introduced during the Clinton regime and the hedonic adjustments ongoing since the 1980s that redefine price rises as quality improvements. Correcting for excessive hedonic adjustments gives a first quarter real GDP contraction of 5%. Correcting for hedonic and substitution adjustments gives a first quarter real GDP contraction of 8.5%.

Realistic economic analysis is a rarity. The financial press echoes Wall Street, and Wall Street economists are paid to help sell financial instruments. Gloomy analysis is frowned upon. Even negative quarters are given a positive spin.

Years of understatement of inflation has resulted in years of overstatement of GDP growth. Thinking about the many years of misstatement, we realized that the typical computation in nominal terms of the ratio of debt to GDP is seriously misleading.

Consider that debt is issued in nominal terms and repaid in nominal terms (except for a few Treasury bonds with inflation adjustments). However, nominal wealth or nominal GDP overstates real economic strength. The debt is growing, but both the nominal and real values of the output of goods and services are not keeping up with the rise in debt.

To understand how risky the rise of debt is, nominal debt must be compared to real GDP. Spin masters might dismiss this computation as comparing apples to oranges, but such a charge constitutes denial that the ratio of nominal debt to nominal GDP understates the wealth dilution caused by the government’s ability to issue and repay debt in nominal dollars. We know that inflation favors debtors, because debts can be repaid in inflated dollars.

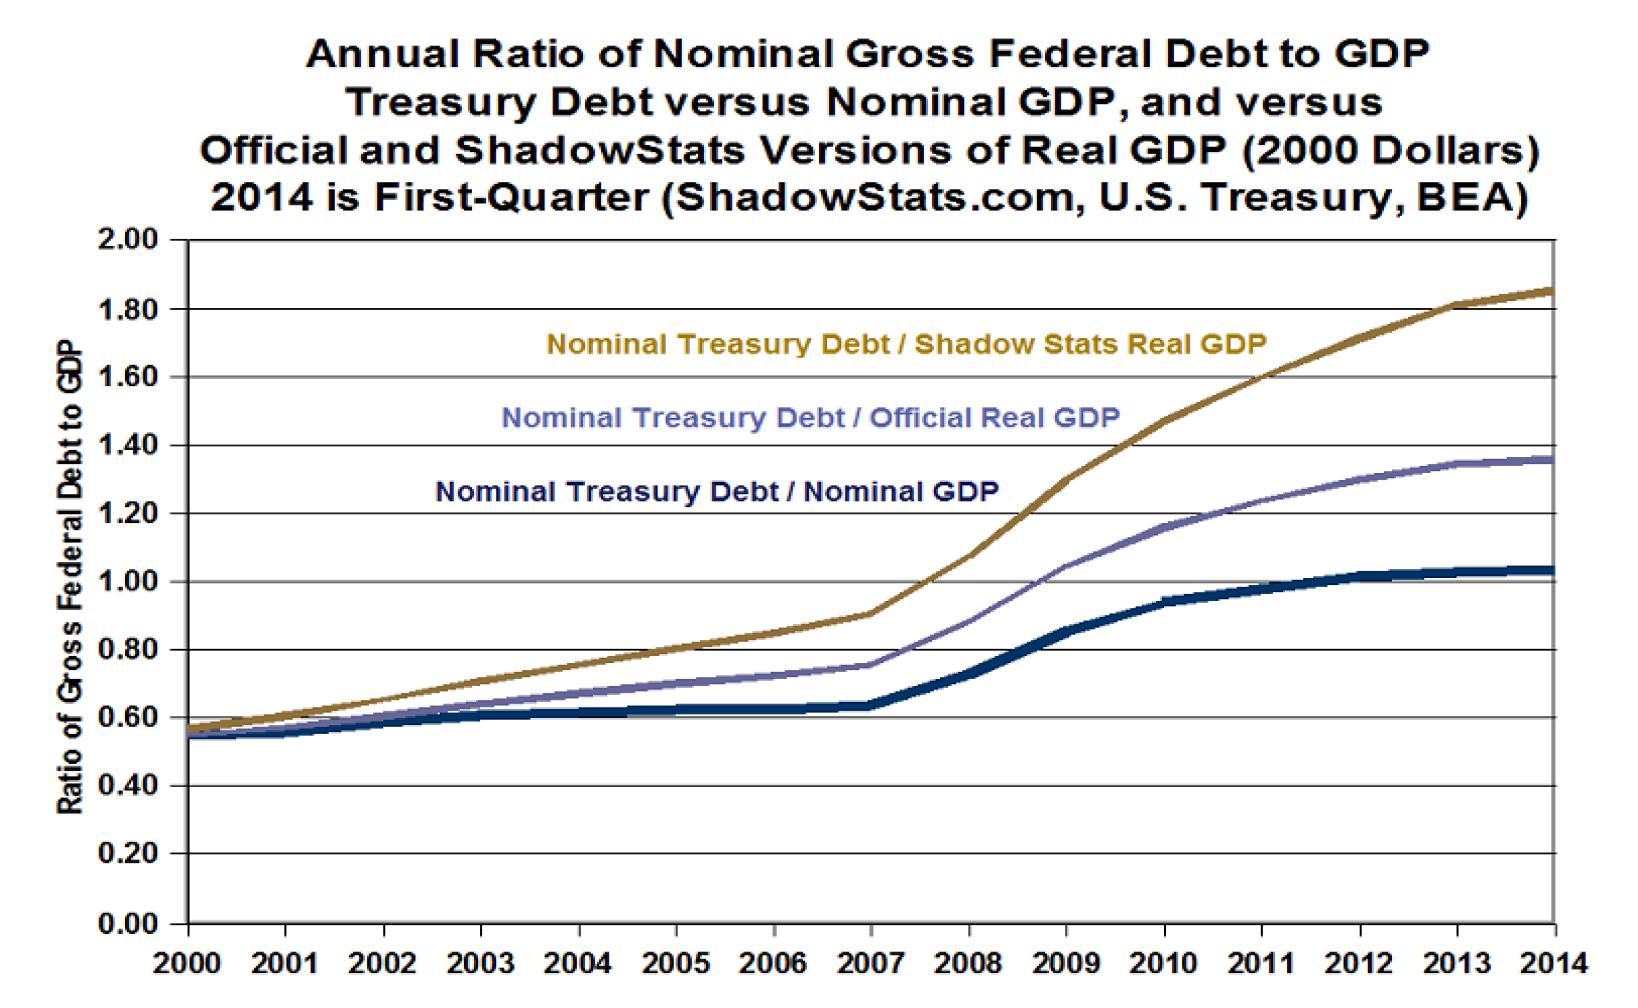
The graph below shows three different debt to GDP ratios. The bottom line is nominal debt to nominal GDP, the financial press ratio. The middle line is the ratio of nominal debt to the official measure of real GDP. The top line is the ratio of nominal GDP to Shadowstats’ corrected measure of real GDP that puts back in some of the inflation that is no longer included in official measures. The basis for this corrected measure is also 2000, but as the GDP number for 2000 is lower due to correction, this graph begins with the ratio at a slightly higher point.


The nominal debt to GDP ratio shows that as of the end of the first quarter of 2014 total US Treasury debt outstanding is 103 percent of US GDP.

The ratio of Treasury debt to official real GDP shows debt at 136% of GDP.

The ratio of debt to real GDP deflated with more a more realistic measure of inflation, one more in keeping with the experience of consumers, puts US public debt at 185% of GDP. In other words, the burden of US debt on the real economy is almost twice the burden that is normally perceived.

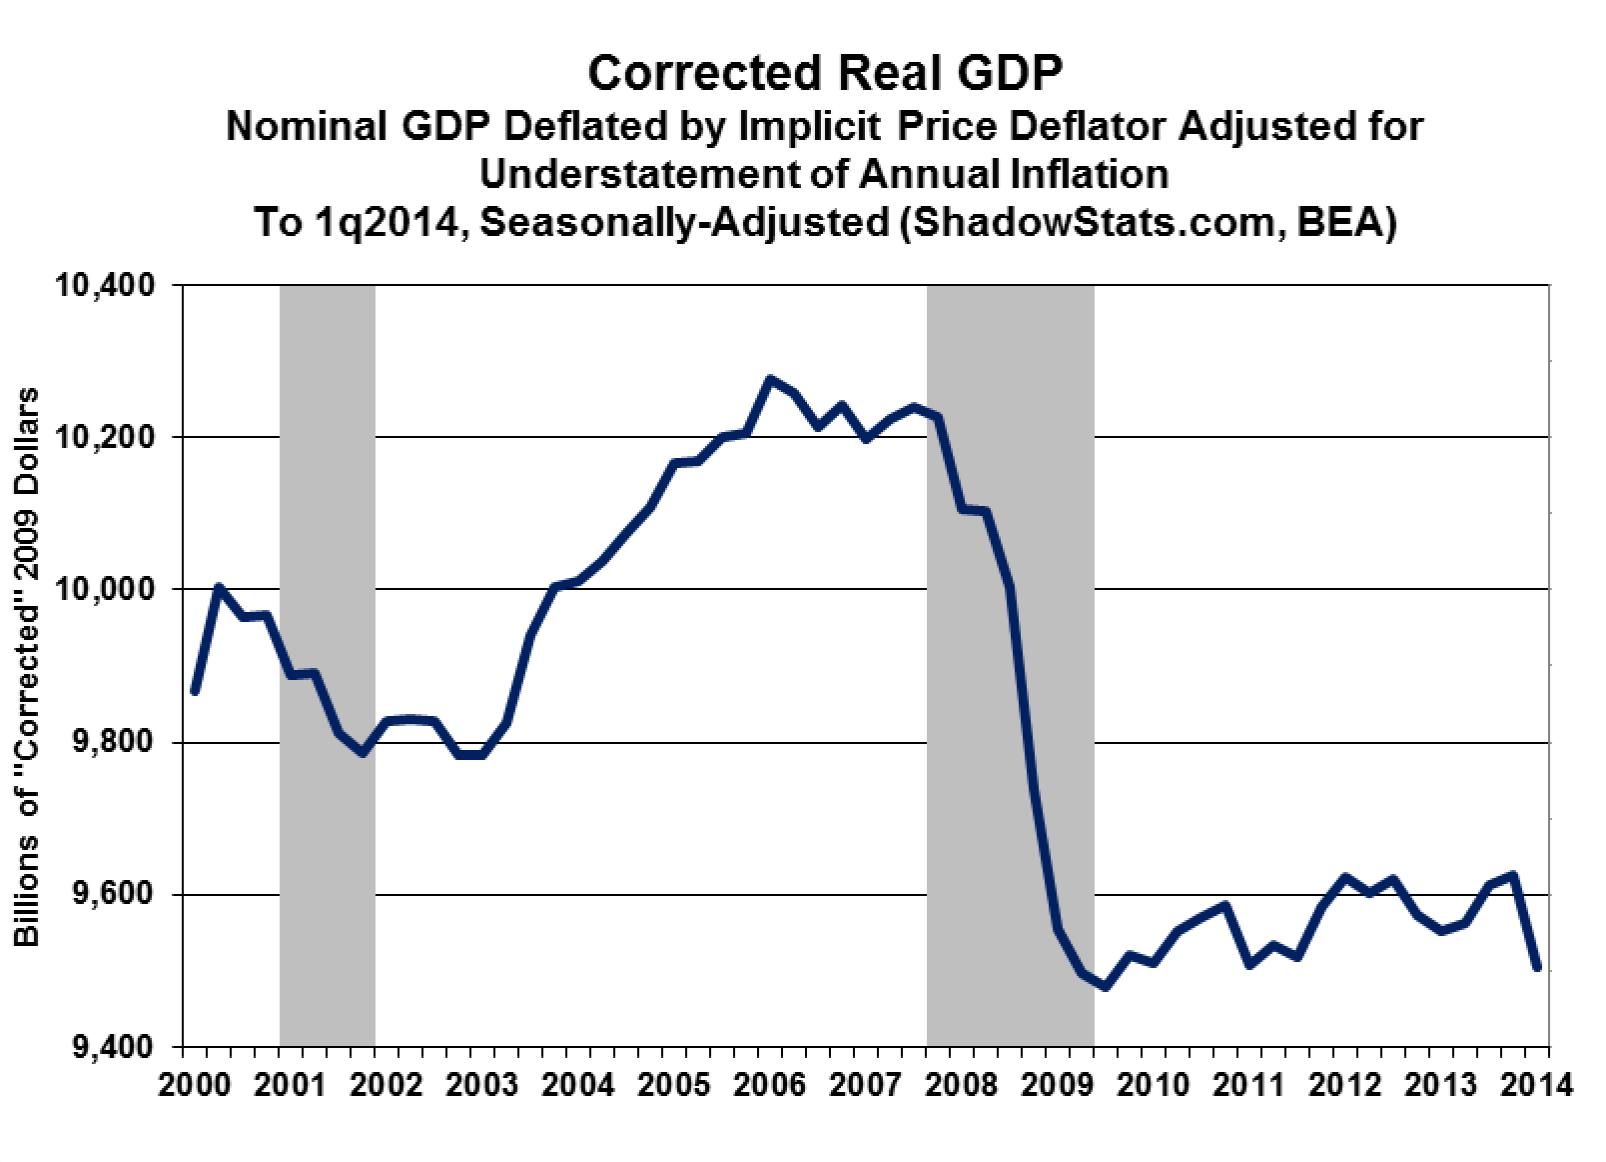
The Shadowstats adjustment we made to real GDP does not fully correct for what we believe has been a growing understatement of inflation since the 1980s. The adjustment we made corrects the implicit price deflator for a two-percentage point understatement of annual inflation due to hedonic distortion. Real GDP with this correction since 2000 looks like this:


We have calculated the ratios of US public debt to nominal GDP and to two measures of real GDP. The ratios of debt to GDP would be much higher if we used total credit outstanding, or total public and private debt, and if we used the government’s unfunded liabilities. The fact seems clear that debt is a major and unappreciated issue for the US economy. The enormous debt, especially with the middle class economy largely offshored, implies substantially lower living standards for the 99 percent.

The first quarter contraction, especially our corrected number, implies a second quarter negative real GDP. In other words, the years of Quantitative Easing (money printing) by the Federal Reserve has not resulted in economic recovery from the 2008 downturn and has not prevented further contraction.

Massive money creation and huge fiscal deficits have protected the balance sheets of “banks too big to fail” but have harmed the American people. Retirees and pension funds have been deprived for years of interest income as the Federal Reserve engineered zero or negative interest rates for the sake of a handful of oversized banks.

The extraordinary creation of new dollars diluted the dollars held by peoples, companies, institutions, and central banks throughout the world, raising fears that the dollar would lose exchange value and its role as world reserve currency.

Washington’s use of financial sanctions to force other countries to bend to Washington’s will is causing countries to leave the dollar payments system. Russian President Vladimir Putin’s advisor has said that the dollar must be crashed as the only way to prevent US aggression. The Chinese have called for “de-americanizing the world.”

The imperialistic US Foreign Account Tax Compliance Act (FATCA), which comes into full force July 1, 2015, imposes such heavy reporting costs on foreign financial institutions that these institutions might opt out of dollar transactions. All together, the result could be a serious tumble in the value of the US dollar, more wealth contraction, higher inflation via import prices, and less US wealth available to support US debt.

In view of this reality, why is Washington pushing its puppet in Kiev toward war with Russia? Why is Washington pushing NATO to spend more money and build more bases on which to deploy more troops in the Baltics and Eastern Europe, especially when Washington’s contribution will be the largest part of the cost? Why is Washington re-entering the Middle East conflict that Washington began by inciting Sunni and Shia against one another? Why is Washington constructing new naval and air bases from the Philippines to Vietnam in order to encircle China?

If Washington is this unaware of its budget constraints and its financial predicament, it cannot be long before Americans experience economic catastrophe.

Tuesday, February 4, 2014

Prelude to a Crash

Margin Debt Hits All-Time High in December
by MIKE WHITNEY

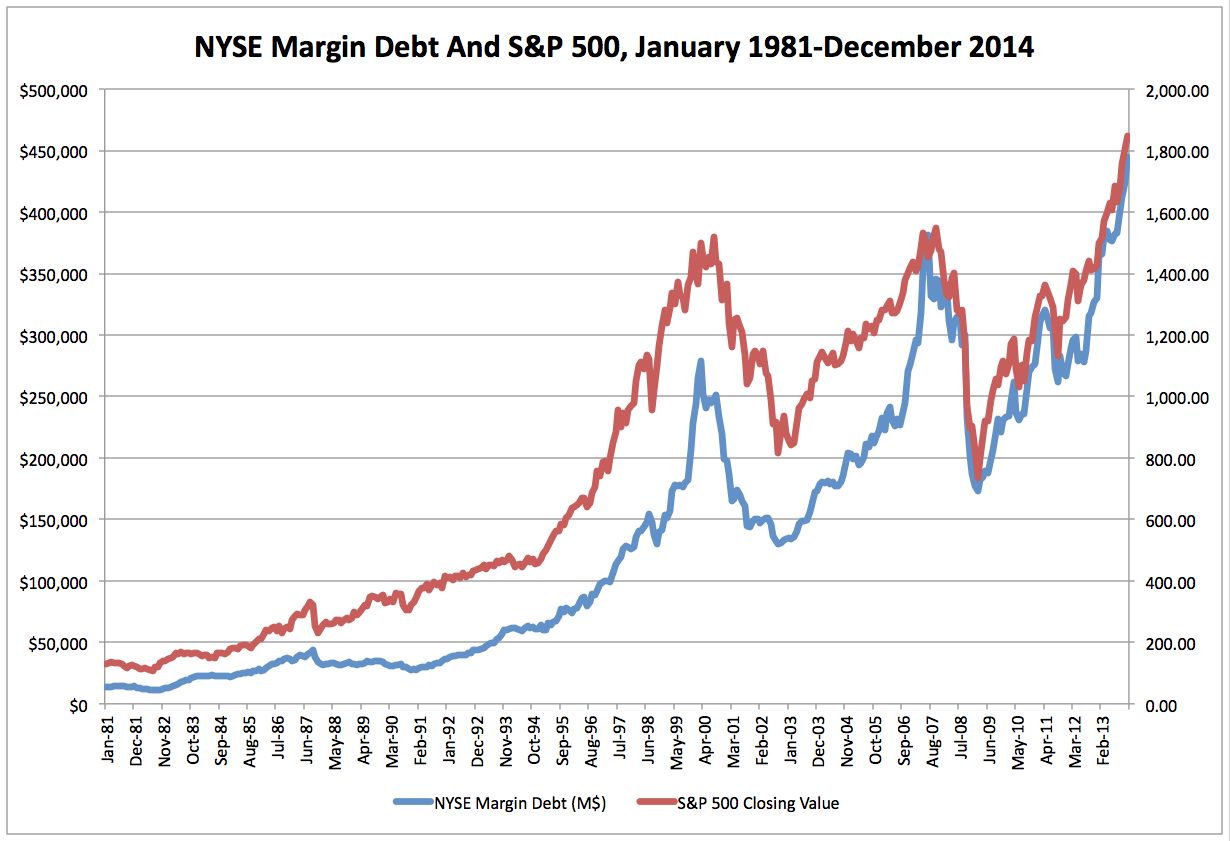
The Fed’s easy money policies have pushed margin debt on the New York Stock Exchange (NYSE) to record levels laying the groundwork for a severe correction or another violent market crash.

In December, margin debt rose by $21 billion to an all-time high of $445 billion.

Buying equities on margin, that is, with loads of borrowed cash, is a sign of excessive risk taking the likes of which invariably takes place whenever the Central Bank creates subsidies for speculation by keeping interest rates pegged below the rate of inflation or by pumping trillions of dollars into the bloated financial system through misguided liquidity programs like QE.

Investors have shrugged off dismal earnings reports, abnormally-high unemployment, flagging demand, droopy incomes, stagnant wages and swollen P/E ratios and loaded up on stocks confident that the Fed’s infusions of liquidity will keep prices going higher. It’s only a matter of time before they see the mistake they’ve made.

The chart below illustrates how zero rates and QE lead to excessive risk taking. The correlation between the stratospheric rise of margin debt and the Fed’s destabilizing monetary policy is hard to avoid. This is what bubblemaking looks like in real time.


Chart: Seeking Alpha.

In the minutes of the FOMC’s December meeting, FOMC officials acknowledge the froth they’ve created in financial assets which is why they’ve begun to scale back their asset purchases. The Fed hopes that by gradually winding down QE they’ll be able to stage a soft landing rather than a full-blown crash. Here’s an excerpt from the FOMC’s minutes:
“In their discussion of potential risks, several participants commented on the rise in forward price-to-earnings ratios for some smallcap stocks, the increased level of equity repurchases, or the rise in margin credit. One pointed to the increase in issuance of leveraged loans this year and the apparent decline in the average quality of such loans.”

There you have it, the Fed sees the results of its work; the distortions in P/E ratios, the exuberant stock buybacks (“equity repurchases”), the deterioration in the quality of leveraged loans, and the steady rise in margin debt. They see it all, all the bubbles they’ve created with their gargantuan $3 trillion surge of liquidity. Now they have started to reverse the policy by reducing their asset purchase from $85 bil to $65 bil per month, the effects of which can already be seen in the Emerging Markets.

The bubble in Emerging Markets has burst sending foreign currencies plunging and triggering a sharp reversal in capital flows. The hot money that flooded the EMs,–(which lowered the cost of borrowing for businesses and consumers)–is entirely attributable to the Fed’s policy. QE pushes down long-term interest rates forcing investors to search for higher yield in other markets. Thus, the cost of money drops in EMs creating a boom that abruptly ends when the policy changes (as it has).

Capital is fleeing EMs at an unprecedented pace precipitating a dramatic slowdown in economic activity, higher consumer prices and widespread public distress. The Fed is 100% responsible for the turmoil in emerging markets, a fact which even mainstream news outlets blandly admit. Here’s an excerpt from an article in Bloomberg just this week:
“Investors are pulling money from exchange-traded funds that track emerging markets at the fastest rate on record…More than $7 billion flowed from ETFs investing in developing-nation assets in January, the most since the securities were created, data compiled by Bloomberg show…

Emerging economies have benefited from cheap money as three rounds of Fed bond buying pushed capital into their borders in search of higher returns…

The Fed’s asset purchases had helped fuel a credit boom in developing nations from Turkey to Brazil. Accumulated capital inflows to developing-country’s debt markets since 2008 reached $1.1 trillion, or $470 billion more than their long-term trend, according to a study by the International Monetary Fund in October.” (“Record Cash Leaves Emerging Market ETFs on Lira Drop“, Bloomberg)

The Fed doesn’t care if other countries are hurt by its policies. What the Fed worries about is how the taper is going to effect Wall Street. If the slightest reduction in asset purchases causes this much turbulence abroad, then what’s it going to do to US stock and bond markets?

The answer, of course, is that stocks are going to fall…hard. It can’t be avoided. And while the amount of margin debt is not a reliable tool for calling a top; it’s safe to say that the recent spike in investor leverage has moved the arrow well into the red zone. Investors are going to cash out long before the Fed ends QE altogether, which means the selloff could persist for some time to come much like after the dot.com bubble popped and stocks drifted lower for a full year. Now check out this clip from Alhambra Investment Partners newsletter titled “The Year of Leverage”:
“For the year, total margin debt usage jumped by an almost incomprehensible $123 billion, while cash balances declined by $19 billion. That $142 billion leveraged bet on stocks far surpasses any twelve month period in history. The only times that were even close to as leveraged were the year leading up to June 2007 (-$89 billion) and the twelve months preceding February and March 2000 (-$77 billion). Both of those marked significant tops in the market.” ( Alhambra Investment Partners newsletter titled The Year of Leverage)

Repeat: “The $142 billion leveraged bet on stocks far surpasses any twelve month period in history.” 

Investors are “all-in” because they think that the Fed has their back. They think that Bernanke (or Yellen) will not allow stocks to fall too far without intervening. (This is called the “Bernanke Put”) So far, that’s been a winning strategy, but that might be changing. The Fed’s determination to taper suggests that it wants to withdraw its stimulus to avoid being blamed for the bursting bubble. (“Plausible deniability”?) That’s what’s driving the current policy. Here’s more on margin debt from Wolf Richter at Testosterone Pit:
“On the New York Stock Exchange, margin credit has been hitting new records for months. All three mega-crashes in my investing lifetime have been accompanied by record-setting peaks in margin debt. In September 1987, a month before the crash, margin credit peaked at 0.88% of GDP. In March 2000, when the crash began, margin credit peaked at 2.7% of GDP. In July 2007, three months before the downdraft started, margin credit peaked at 2.6% of GDP. Now, margin credit has already reached 2.5% of GDP.” (“Plagued By Indigestion, Fed Issues Asset-Bubble Warning”, Testosterone Pit)

Stock market crashes are always connected to massive leverage, loosey-goosey monetary policy and irrational exuberance (“excessive risk taking”), the toxic combo that presently rules the markets. The Federal Reserve is invariably the source of all bubblemaking and financial instability.

As we noted earlier, equity repurchases or stock buybacks are another sign of froth. Here’s an excellent summary on the topic by Alhambra Investment Partners:
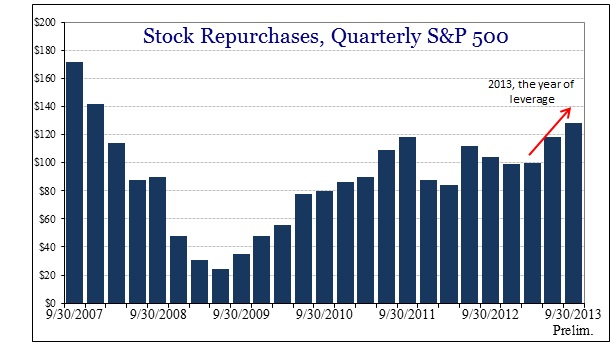
“In the third quarter of 2013, share repurchases totaled $128.2 billion, the highest level since Q4 2007. For the twelve months ended in September 2013, aggregate share repurchases were an astounding $445.3 billion; the only twelve-month period greater than that total was the calendar year of 2007 and its $589 billion.

The common argument advanced in favor of such share repurchases is that companies are using cash to recognize undervalued stocks, but that is total hogwash…

…corporate managers are no different than the reviled stereotypical retail investor. Both leverage themselves further and further as the market goes higher, not in recognizing undervalued stocks or companies but in full froth of chasing obscene values via rationalizations.” ( Alhambra Investment Partners newsletter titled “The Year of Leverage”)


In other words, corporate managers are doing the same thing as your average margin investor. They are loading up on financial assets–not because they think they are a good value or because they expect higher earnings –but because Fed policy supports artificially-high prices. That’s what’s driving the bull market, the Fed’s thumb on the scale. Remove the thumb, and you have a whole new ballgame (as we see in the EMs). There’s also a bubble in high yield “junk” bonds which just had their second biggest year on record (Total issuance $324 billion) Investors are only too happy to dump their money into high-risk debt believing that companies never default or that the Fed will save the day again credit tightens and the dominoes start tumbling through the debt markets. According to Testosterone Pit:

“The cost of a high-yield bond on an absolute coupon basis is as low as it’s ever been,” explained Baratta, king of Blackstone’s $53 billion in private equity assets. Even the riskiest companies are selling the riskiest bonds at low yields… Why would anyone buy this crap?” (“Bubble Trouble: Record Junk Bond Issuance, A Barrage Of IPOs, “Out Of Whack” Valuations, And Grim Earnings Growth”, Testosterone Pit)

Why, indeed? Of course, the author is just being rhetorical, after all, he knows why people are piling into junk. It’s because the Fed has kept a gun to their heads for 5 years, forcing them to grab higher yield wherever they can find it. That’s how Bernanke’s dogwhistle monetary policy works. By slashing rates to zero, the Fed coerces investors to speculate on any type of garbage that’s available. That why junk “just had its second biggest year on record.” You can thank Bernanke.

Housing is also in a bubble due to the Fed’s zero rates, withheld inventory, government modification programs, and an unprecedented uptick in all-cash investors. Clearly, there’s never been a market more manipulated than housing. It’s a joke.

The surge of Wall Street liquidity has spilled over into housing distorting prices and reducing the number of firsttime homebuyers to an all-time low. The homeownership rate is actually falling even while prices climb higher, which is just one of many anomalies created by the Fed’s policy. (Who’s ever heard of a housing boom, where the number of firsttime homebuyers is dropping?)

Also, the Central Bank has purchased more than $1 trillion in mortgage-backed securities (MBS) via QE, which begs the question: How can housing prices NOT be in a bubble?

As we noted earlier, the Fed understands the impact its policies have had. They know the markets are overheated and they’re determined to do something about it. A recent article in Bloomberg explains the Fed’s plan for winding down QE “without doing damage to the economy”. Here’s a short excerpt from the piece:
“Janet Yellen probably will confront a test during her tenure as Federal Reserve chairman that both of her predecessors flunked: defusing asset bubbles without doing damage to the economy…

Yellen is ‘going to be trying to do something that no one has ever done,’ said Stephen Cecchetti, former economic adviser for the Bank for International Settlements, the Basel, Switzerland-based central bank for monetary authorities. She needs ‘to ensure that accommodative monetary policy doesn’t create significant financial stability risks,’ he said in an interview…

The Fed’s ‘first, second and third lines of defense” for dealing with such imbalances is to rely on supervision, regulation and so-called macro-prudential policies, such as mortgage loan-to-value restrictions, Bernanke told the Brookings Institution in Washington on Jan. 16. ….Only as a last resort would it consider raising interest rates.’ (“Yellen Faces Test Bernanke Failed: Ease Bubbles“, Bloomberg)

You got that?

So the Fed is going into the “bubble-deflating” biz.

Check.

And uber-dove Yellen is going to put things right. She’s going to eliminate the price distortions and gradually return the markets to normalcy.

Right, again.

She’s going to wind down QE and start to reduce the Fed’s $4 trillion balance sheet.

Oakie dokie.

And she’s going to do all of this without raising interest rates or sending stocks into freefall?

Right. It’s a pipedream. The first sign of trouble and old Yellen will be scuttling across the floor of the New York Stock Exchange with a punch bowl the size of Yankee Stadium.

You can bet on it.

Wednesday, January 29, 2014

How Economists and Policymakers Murdered Our Economy

Enabling Greed
by PAUL CRAIG ROBERTS

The economy has been debilitated by the offshoring of middle class jobs for the benefit of corporate profits and by the Federal Reserve’s policy of Quantitative Easing in order to support a few oversized banks that the government protects from market discipline. Not only does QE distort bond and stock markets, it threatens the value of the dollar and has resulted in manipulation of the gold price.

When US corporations send jobs offshore, the GDP, consumer income, tax base, and careers associated with the jobs go abroad with the jobs. Corporations gain the additional profits at large costs to the economy in terms of less employment, less economic growth, reduced state, local and federal tax revenues, wider deficits, and impairments of social services.

When policymakers permitted banks to become independent of market discipline, they made the banks an unresolved burden on the economy. Authorities have provided no honest report on the condition of the banks. It remains to be seen if the Federal Reserve can create enough money to monetize enough debt to rescue the banks without collapsing the US dollar. It would have been far cheaper to let the banks fail and be reorganized.

US policymakers and their echo chamber in the economics profession have let the country down badly. They claimed that there was a “New Economy” to take the place of the “old economy” jobs that were moved offshore. As I have pointed out for a decade, US jobs statistics show no sign of the promised “New Economy.”

The same policymakers and economists who told us that “markets are self-regulating” and that the financial sector could safely be deregulated also confused jobs offshoring with free trade. Hyped “studies” were put together designed to prove that jobs offshoring was good for the US economy. It is difficult to fathom how such destructive errors could consistently be made by policymakers and economists for more than a decade. Were these mistakes or cover for a narrow and selfish agenda?

In June, 2009 happy talk appeared about “the recovery,” now 4.5 years old. As John Williams (shadowstats.com) has made clear, “the recovery” is entirely the artifact of the understated measure of inflation used to deflate nominal GDP. By under-measuring inflation, the government can show low, but positive, rates of real GDP growth. No other indicator supports the claim of economic recovery.

John Williams writes that consumer inflation, if properly measured, is running around 9%, far above the 2% figure that is the Fed’s target and more in line with what consumers are actually experiencing. We have just had a 6.5% annual increase in the cost of a postage stamp.

The Fed’s target inflation rate is said to be low, but Simon Black points out that the result of a lifetime of 2% annual inflation is the loss of 75% of the purchasing power of the currency. He uses the cost of sending a postcard to illustrate the decline in the purchasing power of median household income today compared to 1951. That year it cost one cent to send a post card. As household income was $4,237, the household could send 423,700 postcards. Today the comparable income figure is $51,017. As it costs 34 cents to send one postcard, today’s household can only afford to send 150,050 postcards. Nominal income rose 12 times, and the cost of sending a postcard rose 34 times.

Just as the American people know that there is more inflation than is reported, they know that there is no recovery. The Gallup Poll reported this month that only 28% of Americans are satisfied with the economy.

From hard experience, Americans have also caught on that “free trade agreements” are nothing but vehicles for moving their jobs abroad. The latest effort by the corporations to loot and defraud the public is known as the “Trans-Pacific Partnership.” “Fast-tracking” the bill allowed the corporations to write the bill in secret without congressional input. Some research shows that 90% of Americans will suffer income losses under TPP, while wealth becomes even more concentrated at the top.

TPP affects every aspect of our lives from what we eat to the Internet to the environment. According to Kevin Zeese in Alternet, “the leak of the [TPP] Intellectual Property Chapter revealed that it created a path to patent everything imaginable, including plants and animals, to turn everything into a commodity for profit.”

The secretly drafted TPP also creates authority for the executive branch to change existing US law to make the laws that were not passed in secret compatible with the secretly written trade bill. Buy American requirements and any attempt to curtail jobs offshoring would become illegal “restraints on trade.”

If the House and Senate are willing to turn over their legislative function to the executive branch, they might as well abolish themselves.

The financial media has been helping the Federal Reserve and the banks to cover up festering problems with rosy hype, but realization that there are serious unresolved problems might be spreading. Last week interest rates on 30-day T-bills turned negative. That means people were paying more for a bond than it would return at maturity. Dave Kranzler sees this as a sign of rising uncertainty about banks. Reminiscent of the Cyprus banks’ limits on withdrawals, last Friday (January 24) the BBC reported that the large UK bank HSBC is preventing customers from withdrawing cash from their accounts in excess of several thousand pounds.

If and when uncertainty spreads to the dollar, the real crisis will arrive, likely followed by high inflation, exchange controls, pension confiscations, and resurrected illegality of owning gold and silver. Capitalist greed aided and abetted by economists and policymakers will have destroyed America.

Thursday, December 5, 2013

The Stock Market Bubble

Back to the Future on Wall Street
by MIKE WHITNEY


Wall Street is buzzing, and it’s all about bubbles.

In fact, according to Google Trends, interest in the term “stock bubble” was higher in November 2013 than anytime since October 2008.

And that should be expected given that the Dow Jones just broke through the 16,000-mark while the NASDAQ sailed-past the 4,000 milestone for the first time in 13 years. And did I mention that S&P 500 just closed above 1,800 for an all-time high?

While surging stocks are not proof of a bubble, they do draw attention to the condition of the underlying economy which is still in deep distress 5 years after the recession "ended." With "official" unemployment at 7.2% (and real unemployment twice that figure), GDP barley growing, droopy personal consumption, flagging durable goods, shrinking revenues, flatlining wages, falling incomes, widening inequality, plunging consumer sentiment, 47 million Americans on food stamps, and myriad other signs of persistent economic stagnation; the so called “recovery” is anything but robust. So where are stocks getting the oomph to keep rising?

That’s not a question that bothers the bubble deniers who have started popping up on the business channels like they did prior to the housing and the dot.com busts. These so called “experts” assure the public that all the bubble talk is just scaremongering by disgruntled Cassandras who don’t understand that current valuations are reasonable. They say that soaring prices reflect “strong fundamentals.

Uh huh.

Last week, serial bubblemaker, Alan Greenspan, made an appearance on Bloomberg TV where he scoffed at the idea of a stock bubble saying, “It’s a little on the upside, (But) “This does not have the characteristics, as far as I’m concerned, of a stock market bubble.”

There you have it from Maestro himself. No bubble here. Move along now.

Others, however, are not as confident as Greenspan. They think stock prices have less to do with fundamentals than they do with the Fed’s uber-accommodative policy which has kept short-term rates set below the rate of inflation for 5 years straight, providing a subsidy for risk taking. They also point to Fed chairman Ben Bernanke’s $85 billion per month asset purchase program, called QE, which has expanded the Fed’s balance sheet by $3 trillion lifting stock and bond prices across the board. Stock prices are based on Central Bank intervention. Fundamentals have nothing to do with it, nothing at all.

As for the bubble; judge for yourself:

Margin debt on the New York Stock Exchange is currently at its highest level ever. It’s even higher than before the crash in 2007. When investors borrow a lot of dough to buy stocks, you’re in a bubble, right? Because that’s what a bubble is, tons of credit pushing up prices. And when something bad happens, like the Lehman Brothers default, then all the over-extended borrowers have to dump their stocks pronto, which causes firesales, panics and financial meltdowns. Been there, done that.

So why is there so much margin debt now, you ask?

Because of zero rates. Because of QE. Because speculators think the Fed will keep prices high by pumping more liquidity into the system. It’s called the Bernanke Put, the belief that the Fed will prevent stocks from falling too fast, too far. Margin debt is a reasonable reaction to the Fed’s policy, which is why the Fed is ultimately responsible for the risky behavior.

Now check this out from the New York Times:
“Since the dark days of 2008, the Nasdaq has risen more than 150 percent, twice as much as the old-school Dow industrials. Money has been pouring into social media stocks. As of Friday, Twitter had risen nearly 60 percent since it went public only a few weeks earlier.

Once again, new “metrics” are being applied to justify stratospheric valuations. Twitter is losing money. A price-to-earnings ratio? There is no E in the P/E. But its stock is trading at 20-odd times the company’s annual sales. Good enough….

Eight months ago, Snapchat was valued at $70 million. Today, it is valued at $4 billion, even though it has zero revenue. Six months ago, Pinterest was valued at $2.5 billion. Today, it is valued at $3.8 billion — and no revenue there, either. And last week news broke that Dropbox was said to be seeking a new round of funding that would value the company at $8 billion, up from $4 billion a year ago.” (“Disruptions: If It Looks Like a Bubble and Floats Like a Bubble”, New York Times)

Did you catch that? A company with zero revenue is worth $3 billion more today than it was 8 months ago. So we’re back to the bad old days of the dot.com bust. This is the result of low rates and QE. It has nothing to do with fundamentals. We’re not talking earnings here. We’re talking manipulation, intervention, and central planning.
 
Then there’s this from the Wall Street Journal:
“Investment funds aimed at individual investors are barreling into collateralized loan obligations, a complex and volatile type of security that was shaken by the financial crisis.

Lured by annual returns of as high as 20%, some mutual-fund managers are buying CLOs through investment funds that purchase stakes in loans to companies with low credit ratings…. …

The biggest buyers of these securities usually are hedge funds, insurers and banks. But mutual funds and business-development companies, which pitch themselves to individual, or retail, investors, have collected more than $60 billion in money from clients this year, according to Keefe, Bruyette & Woods, Inc. and fund-data provider Lipper.

CLO returns are higher than on corporate bonds and other loans, but CLO prices could plunge if the risk rises that companies will run into trouble repaying their loans. That happened in 2011, and some fund managers say retail investors are mostly unaware that the firms they invest in are buying CLOs…” (“Volatile Loan Securities Are Luring Fund Managers Again”, Wall Street Journal)
So the big boys are climbing further out the risk curve to scratch out a higher rate of return on their investments; investments which–by the way– will eventually cost ”retail investors” (you and me) a bundle. 
 
And the reason these financial institutions are engaging in such risky behavior is because rates have been stuck at zero for 5 years, forcing them to look for higher yield wherever they can find it. It’s all part of the Fed’s Pavlovian conditioning. First you turn the interest rate dial to zero, then you juice stock’s prices with QE. And then you wait for the suckers (Mom and Pop) to reenter the market so you can cut them down like corn stalks in a combine. Works every time, just take a look:
“One development that has experts concerned is the return of individual investors, who are known for getting into the stock market near peaks…One way to measure their activity is to look at net inflows into stock mutual funds (excluding exchange-traded funds). When investors put more into stock funds than they take out, it’s called a net inflow. When they withdraw more than they invest, it’s a net outflow.

This year, net inflows totaled $176 billion through Nov. 20, according to Lipper…Most of that money is coming from bank accounts and money market funds…”

So the sheeple are about to get sheared again, right? Just like Bernanke and his Wall Street buddies planned from the get go. But, guess what? Just as Mom and Pop are getting back into stocks again, the big boys are getting out. Take a look at this report from BofAML from the Macronomics blogsite:

”BofAML clients were net sellers of US stocks for the fifth consecutive week, in the amount of $2.3bn. Net sales were led by institutional clients, who returned to net selling following a week of muted buying.

Institutional clients remain the biggest net sellers year-to-date, with cumulative net sales of over $23bn—larger than in either 2008 or 2010. …..Hedge funds were also net sellers for the second consecutive week, while private clients returned to net buying after a week of selling. This group has been a net buyer for 23 of the past 26 weeks.” (“Credit: All that glitters, ain’t gold”, Macronomics)

How do you like that? So once the chickens get lured back into the henhouse, the door slams shut and the fox fires up the stove for another big feed. Isn’t this how it always works out?

Now check this out in Forbes about ”cov lite” loans:

“Covenant-lite loan activity in 2013 is smashing all records, and appears to be picking up speed. Through Aug. 8 there has been $162 billion of covenant-lite loan issuance in the U.S., more than five times the amount seen at this point in 2012, and easily topping the $86 billion of cov-lite deals logged all of last year.” (“Cov lites” soar to new record”, Forbes)

Unfortunately, cov lites are a particularly lethal form of lending which strips “typical lender protections” from credit agreements. Here’s the scoop from the New York Times:

“Leveraged loans became popular before the 2008 collapse but nearly disappeared afterward, regarded as a symbol of unbridled lending. But they started to return in 2010 and are now back in force, with volumes of $548.4 billion this year through Nov. 14, already exceeding the precrisis level of $535.2 billion in 2007.

The type of leveraged loans that Learfield took out are known as covenant-lite, financial lingo for loans that lack the tripwires that could alert investors to any potential financial troubles at the company that could affect repayment. More than half of all leveraged loans issued this year have been the so-called cov-lite types, double the level seen in 2007 on the eve of the credit crash.” (“New Boom in Subprime Loans, for Smaller Businesses”, New York Times)

So, let’s recap: The Fed has managed to spark another surge in risky lending (that “exceeds precrisis levels”) that threatens to blow up in investors faces leaving them less prepared for retirement than they are today.

Check.

And there’s more. Take a look at the recent stock buyback frenzy, which is where companies buy their own stock to goose the price instead of investing in plants, equipment, hiring, or any other type of useful, productive activity. This is from Bloomberg:
“Multiple expansion through share buybacks have been driving indeed the stock market higher greater than earnings have. …. Buybacks rose by 18% Quarter-over-quarter to $118 billion in 2013, up 11% year-over-year to $218 billion.”  (Bloomberg)

Even so, Greenspan sees no bubble. Stock prices are based on good old fundamentals, like earnings. What could be more fundamental than earnings, right?

Take a look at this from the Testosterone Pit:
“Corporate earnings will grow this year at their lowest level since 2009. Revenue growth at public companies is almost non-existent. Companies are buying back stock at a record pace to boost per-share earnings.”  (“What Really Bothers Me About this Stock Market”,  Michael Lombardi, Testosterone Pit)
Huh? So earnings aren’t so hot either?

Apparently not. And that means the fundamentals are actually weak, which makes sense since the economy is in the crapper.

Then we ARE in a bubble, after all?

Yep. And when it bursts it’s going to cost a lot of people a lot of money.  Just like last time.

Thursday, September 19, 2013

The Greatest Debt Crisis The World Has Ever Seen Is Coming

September 17th, 2013
By Michael Snyder


U.S. National Debt 2013


The largest mountain of debt in the history of the world just continues to grow even larger, and everyone knows that this colossal debt spiral is not going to end well. But we all keep playing along because nobody wants the party to end. Right now, there is an unprecedented ocean of red ink covering the planet. Globally, governments have never been in so much debt, corporations have never been in so much debt and consumers have never been in so much debt. But every time someone suggests that this is a problem and that we should at least try to get debt levels to settle down a bit, people start screaming that “austerity” will hurt the global economy. And of course it will. But we can’t continue to live way, way above our means indefinitely. Well, we can try, but at some point this entire house of cards is going to come crashing down and we are going to be facing the greatest economic crisis the world has ever seen.

It is kind of like watching a slow-motion train wreck that you have no chance of possibly stopping that you know will end up killing lots of innocent people. This debt crisis is going to end up destroying the global financial system, but there is not a thing that you or I can do to prevent it from happening. The unprecedented debt binge that we are witnessing right now is going to continue until someday we hit a brick wall of financial disaster. We can yell and we can scream, but it isn’t going to stop what is happening.

As the Telegraph recently noted, even the Bank for International Settlements is warning that debt levels are way too high. According to the BIS, total public and private debt levels are now 30 percent higher than they were in 2008…
“This looks like to me like 2007 all over again, but even worse,” said William White, the BIS’s former chief economist, famous for flagging the wild behavior in the debt markets before the global storm hit in 2008.

“All the previous imbalances are still there. Total public and private debt levels are 30pc higher as a share of GDP in the advanced economies than they were then, and we have added a whole new problem with bubbles in emerging markets that are ending in a boom-bust cycle,” said Mr White, now chairman of the OECD’s Economic Development and Review Committee.

The BIS can see the disaster coming, but even they have no chance of preventing it.

For the rest of this article, I am going to focus on government debt, but please keep in mind that corporate debt and consumer debt are also totally out of control globally. It would be very hard to overstate the nightmare that we are facing.

But of course national governments are the biggest offenders when it comes to debt…


Asia

Japan now has a debt to GDP ratio of more than 211 percent, and as Simon Black of the Sovereign Man blog recently detailed, they are rapidly heading toward a national financial meltdown…

Looking purely at the numbers, Japan’s medium-term fundamentals are among the bleakest in the world.

Total government debt amounts to over 200% of the country’s entire GDP– a figure so large that the Japanese government spends 51.5% of the 43 trillion yen ($430 billion) they collect in tax revenue just to pay interest!

Perhaps even more astounding is that ‘primary balance expenses,’ i.e. normal government expenditures, totaled 70.3 trillion yen, or 163% of tax revenue.

The only way they’ve managed to stay afloat is by issuing more debt, which makes the problem even worse. In fact, 46% of the 2013 budget is being financed by debt.

These guys are running out of rope. And fast.

China is facing a different sort of a problem. In that nation, the growth of private domestic debt is wildly out of control.

According to a recent World Bank report, private domestic debt in China has grown from 9 trillion dollars in 2008 to 23 trillion dollars today.

There is no way that is sustainable, and at some point that massive bubble is going to burst.


Europe

Even though some European nations have supposedly implemented “austerity measures” in recent years, debt levels continue to rise rapidly. The following are some numbers that were recently released which show that government debt to GDP ratios for some of the most financially troubled nations in Europe are absolutely soaring
  • Euroarea: 92.2%, up from 88.2% a year ago
  • Greece: 160.5%, up from 136.5% a year ago
  • Italy: 130.3%; up from 123.8% a year ago
  • Portugal: 127.2%, up from 112.3% a year ago
  • Ireland: 125.1%, up from 106.8% a year ago
  • Spain: 88.2%, up from 73.0% a year ago
  • Netherlands: 72.0%, up from 66.7% a year ago
Anyone that tells you that the crisis in Europe is “over” is lying to you. The debt crisis is getting worse, not better.


The United States

The biggest mountain of debt of all can be found in the United States.

30 years ago, the national debt was a little bit above a trillion dollars.

Today, it is rapidly approaching 17 trillion dollars.

At this point, the U.S. already has more government debt per capita than Greece, Portugal, Italy, Ireland or Spain. And since Barack Obama entered the White House, the debt to GDP level has soared to unprecedented heights…


National Debt As A Percentage Of GDP


Sadly, this is just the beginning.

One reason for this is that the U.S. is facing some tremendous demographic challenges in the years ahead.

In other words, our population is getting older.

It is being projected that the number of Americans on Social Security will rise from 57 million today to more than 100 million in 25 years.

How in the world are we possibly going to pay for that?

Already, we are very heavily dependent on foreigners to pay our bills.

According to the U.S. Treasury, foreigners hold approximately 5.6 trillion dollarsof our debt at this point.

China and Russia account for about one-fourth of that total. Right now, China owns approximately 1.275 trillion dollars of our debt, and Russia owns approximately 138 billion dollars of our debt.

So what would happen if we went to war with Syria and they decided to quit borrowing from us and they started dumping our debt instead?

That is a very good question.

And actually, according to Zero Hedge foreigners have already started to dump a little bit of our debt…
Today’s TIC data showed something disturbing: for the fourth month in a row, foreigners were net sellers of US Treasury paper in July, as total foreign holdings declined from $5.600 trillion to $5.590 trillion which represents 49% of total marketable debt (including the debt owned by the Fed of course). In other words, since peaking at $5.724 trillion in March, foreign-held debt has declined by $134 trillion, at a time when yields have surged on fears the Fed’s tapering of its own purchases of bonds will mean less Fed frontrunning opportunities.

We certainly cannot afford for that to continue, because we desperately need other nations to finance our reckless spending.

Our debt is wildly out of control, and the only way we can keep the entire system from collapsing is to go into even more debt.

As I noted recently, if the U.S. national debt was reduced to a stack of one dollar bills it would circle the earth at the equator 45 times.

That is a whole lot of money.

But most Americans do not consider it to be a problem because disaster has not struck yet.

Unfortunately, they simply don’t understand how quickly an exponential problem can overwhelm you. I think that the following illustration from Simon Black is particularly helpful…

Let’s say you’re at a party in a small apartment that’s about 500 square feet in size. Then suddenly, at 11pm, a pipe bursts, starting a trickle into the living room.

Aside from the petty annoyance, would you feel like you were in danger? Probably not. This is a linear problem– the rate at which the water is leaking is more or less constant, so the guests can keep partying through the night without worry.

But let’s assume that it’s an exponential leak.

At first, there’s just one drop of water. But each minute, the rate doubles. So by 11:01pm, there’s 2 drops. By 11:02, 4 drops. And so forth.

By 11:27pm, there’s only six inches of standing water. Yet by 11:31pm, just four minutes later, the entire room is under nearly 8 feet of water. And the party’s over.

For nearly half an hour, it all seemed safe and manageable.People had all the time in the world to leave, right up until the bitter end. 11:27, 11:28, 11:29. Then it all went from benign to deadly in a matter of minutes.

By the time that our politicians and the talking heads on the mainstream media admit that we have a debt emergency on our hands, it will probably be far, far too late.

The greatest debt crisis the world has ever seen is coming, and there is nothing that anyone can do to stop it.

But you can take measures to get prepared for it.

Please get prepared while you still can.

Thursday, August 8, 2013

The “New Economy” Is The No Jobs Economy


One of my most popular columns was about escaping from the Matrix existence in which Americans live. It is a world of disinformation and misinformation in which facts are fiction, and abstract theories are substituted for empirical reality.
Official government statistics are make-believe. The government makes inflation and unemployment disappear by how it defines inflation and unemployment, and it makes the economy grow by how it defines Gross Domestic Product. The definitional basis determines the statistical result.
For example, in his report on the official GDP revisions released July 31, John Williams (shadowstats.com) writes that “academic theories, often with strong political biases, have been used to alter the GDP model over the years, resulting in “Pollyanna Creep,” where changes made to the series invariably have had the effect of upping near-term economic growth.” In other words, definitional changes produce economic growth whether or not the economy produces economic growth.
Inflation is made to disappear by substituting lower priced items for higher priced items and by defining price rises as quality improvements. Thus, the higher prices don’t count as inflation.
Unemployment disappears by defining discouraged workers who cannot find employment as people who are no longer in the work force. 
They simply are disappeared out of the ranks of the unemployed. It reminds me of Punjab’s magic blanket in the old cartoon strip, “Little Orphan Annie.” Punjab disposed of problem people by covering them with his blanket, or perhaps it was a rug, and they disappeared.
Despite the absurdity of the government’s data, Wall Street awaits with baited breath each new release to decide whether markets should go up or down or stay the same. In other words, the financial markets themselves take guidance from make believe numbers. In short, capitalism is rudderless. It has no reliable indicators. Everything is rigged to support the Matrix which keeps the population in a stupor.
Certainly the monthly payroll jobs number is misconstrued and has undeserved influence. If the economy is down, a jobs number significantly higher than the approximately 130,000 new jobs required to stay even with population growth is seen as a beacon of recovery. But the number is so distorted, as John Williams explains, by shifting and unstable seasonal adjustments and an average monthly add-on of 52,000 jobs from the “birth-death” model that no one really knows what the number is. Only a statistician like John Williams who is very familiar with the government’s data procedures can make much sense from the official statistics.
I take a simpler approach. I look at where the reported jobs are alleged to be. In the 21st century, the jobs created by “the world’s largest economy” have been lowly-paid, non-tradable, domestic service third world jobs. Manufacturing and tradable professional service jobs such as software engineering have been moved offshore to low-wage, low-salary locations. The savings in labor costs have enriched corporate executives, Wall Street, and shareholders.
I have made this point monthly for many years, and it has had no effect on economists, policymakers, money managers, or financial markets, all of which continue in their make-believe world of make-believe reality.
Here we go, one more time. Of the 161,000 reported private sector jobs gained in July, 157,000 or 97.5 percent, are in non-tradable domestic services. A non-tradable service is a job that produces services that cannot be exported, such as waitresses, bartenders, hospital orderlies, retail clerks, warehousemen. Thus, no matter how large the number might be, it cannot reduce the huge US trade deficit. Most of these jobs are part-time jobs without health or pension benefits. People in these jobs tend to live hand-to-mouth. These jobs do not produce sufficient income to drive a consumer economy.
Of these 157,000 reported jobs, 63,000 or 40 percent are reported to be in trade, transportation, and utilities. Of these 63,000 jobs, 60,500 of them or 96 percent are in wholesale and retail trade.
Before we go to the next category, ask yourself if you believe that in an economy that has had no recovery, in which there are no new manufacturing or construction jobs, in which the labor force participation rate is down, in which shopping center parking lots are far from full, stores with such a poor sales outlook would hire so many people in July?
Financial activities account for 15,000 of the reported new jobs. The Federal Reserve accounted for 80 percent of these jobs and bill collectors for the rest.
Professional and business services accounted for 36,000 of the new reported jobs. About half of these jobs were temporary help services and services to buildings and dwellings.
Health care and social assistance accounted for 8,300 jobs of which ambulatory health care services comprised 80 percent.
Waitresses and bartenders contributed 38,400 jobs. I have previously noted the anomaly of a population without good employment prospects or rising incomes going out to eat and to drink more and more often, so often that waitresses and bartenders comprise each and every month a significant percentage of the new employees.
In her commissioner’s statement accompanying the jobs report, Erica Groshen acknowledges that 8,200,000 or 6 percent of the currently employed are “involuntary part-time workers” who cannot find full-time employment.
The July 2013 payroll employment level of 136,038,000 stands 2,018,000 below the employment level in January 2008, which was 5 years and 7 months ago. If it requires 130,000 new jobs each month to keep employment equal with population growth, the US economy is behind by 10,728,000 jobs. These missing jobs show up in the declining labor force participation rate and the large number of discouraged workers who are no longer counted as unemployed.
Obviously, there is no economic recovery, despite the reporting of such by the presstitute financial press. Most likely the US economy is sinking further into a depression. The numerous indicators of economic collapse are ignored by economists and financial media busy at work weaving the Matrix to support The Lie.
As former executives of the “banks too big to fail” and their proteges run the US Treasury, the financial regulatory agencies, and the Federal Reserve, US economic policy has been focused on bailing out the excessively large banks created by mindless deregulation. The purpose of US economic policy is to save the large banks from their bad bets on poorly understood new financial instruments in the gambling casino created by deregulation.
The architects of financial deregulation, such as former Senator Phil Gramm and President Bill Clinton were rewarded for their service with fortunes of their own. The free market dupes, who aided and abetted Bill and Phil and misrepresented the repeal of financial stability as a new beginning for laissez faire capitalism, still pretend that the crisis resulted from Congress requiring banks to make mortgage loans to poor black people who could not pay.
The lack of reality in America is extreme. I do not believe anything like it has ever existed in the modern world. Essentially, no one in government or out understands anything.
The combination of the power of vested interests with ideological thinking remote from empirical reality is destroying the US economy and the economic prospects of the American people. The employment profile of the US economy is increasingly that of a third world country. Economic security, except for the rich, has disappeared. A large and growing percentage of the population experiences the insecurity of poverty or near-poverty, while the waiting lists for $50 million yachts expands. The distribution of income is so skewed upward that people of enormous wealth bid up the prices of used Ferraris from the 1950s and 1960s to $12,000,000 and $35,000,000. I can remember when a used Ferrari was something that a person with a moderate income could afford to purchase. I have a friend who bought and sold for $9,000 in the 1960s the Ferrari that last sold for $35 million.
Detroit, once the fourth largest American city and the manufacturing powerhouse of the world, is bankrupt. The populations of the cities that once were America’s thriving manufacturing base are declining. Cleveland has boarded up homes. St. Louis has 20 percent of its homes vacant. Welfare is under attack by the Republicans and even some Democrats as the plight of the population worsens and despair rises.
Washington only responds to the half dozen powerful, rich private interest groups that fund election campaigns. The American people have no one to represent them. The American people have been placed outside the system of “democratic capitalism” which is only for the one percent.
As Jeffrey St. Clair has made clear, America no longer has a left-wing. America is a right-wing world in which people, including “progressives” have been brainwashed into perceiving reality in racial contrast: the whites are well off and the blacks are poor and destitute.
This is the false reality of the Matrix. As whites are a larger percentage of the population than blacks, there are more poor whites than poor blacks. Moreover, the percentage of poor whites is growing. The way the jobs-offshoring, bail out the rich, US economy operates today makes every one poor, including the remnants of America’s once flourishing middle class. It is not a racial issue. It is a class issue. A few people have the power, and they are driving everyone else into the ground. The US government is their agent.
So go wave the flag, support the troops, believe the government’s and media’s lies, but unless you are the well-connected one percent, don’t expect any future for your children. You have been sold out by “your” government. Obama is making pretty speeches, but only the stupid will be fooled.