Showing posts with label inflation. Show all posts

Thursday, July 10, 2014

The Deteriorating Economic Outlook

July 8, 2014

Paul Craig Roberts, Dave Kranzler, and John Williams

The third and final estimate (until the annual GDP revisions) of first quarter 2014 real GDP growth released June 25 by the US Bureau of Economic Analysis was a 2.9% contraction in GDP growth, a 5.5 percentage point difference from the January forecast of 2.6% growth. Apparently, the first quarter contraction was dismissed by those speculating in equities as weather related, as stock averages rose with the bad news.

Stock market participants might be in for a second quarter surprise. The result of many years of changes made to the official inflation measures is a substantially understated inflation rate. John Williams (www.shadowstats.com) provides inflation estimates based on previous official methodology when the Consumer Price Index still represented the cost of a constant standard of living. The 1.26% inflation measure used to deflate first quarter nominal GDP is unrealistic, as Americans who make purchases are aware.

A reasonable correction to the understated deflator gives a much higher first quarter contraction. The two main causes of inflation’s understatement are the substitution principle introduced during the Clinton regime and the hedonic adjustments ongoing since the 1980s that redefine price rises as quality improvements. Correcting for excessive hedonic adjustments gives a first quarter real GDP contraction of 5%. Correcting for hedonic and substitution adjustments gives a first quarter real GDP contraction of 8.5%.

Realistic economic analysis is a rarity. The financial press echoes Wall Street, and Wall Street economists are paid to help sell financial instruments. Gloomy analysis is frowned upon. Even negative quarters are given a positive spin.

Years of understatement of inflation has resulted in years of overstatement of GDP growth. Thinking about the many years of misstatement, we realized that the typical computation in nominal terms of the ratio of debt to GDP is seriously misleading.

Consider that debt is issued in nominal terms and repaid in nominal terms (except for a few Treasury bonds with inflation adjustments). However, nominal wealth or nominal GDP overstates real economic strength. The debt is growing, but both the nominal and real values of the output of goods and services are not keeping up with the rise in debt.

To understand how risky the rise of debt is, nominal debt must be compared to real GDP. Spin masters might dismiss this computation as comparing apples to oranges, but such a charge constitutes denial that the ratio of nominal debt to nominal GDP understates the wealth dilution caused by the government’s ability to issue and repay debt in nominal dollars. We know that inflation favors debtors, because debts can be repaid in inflated dollars.

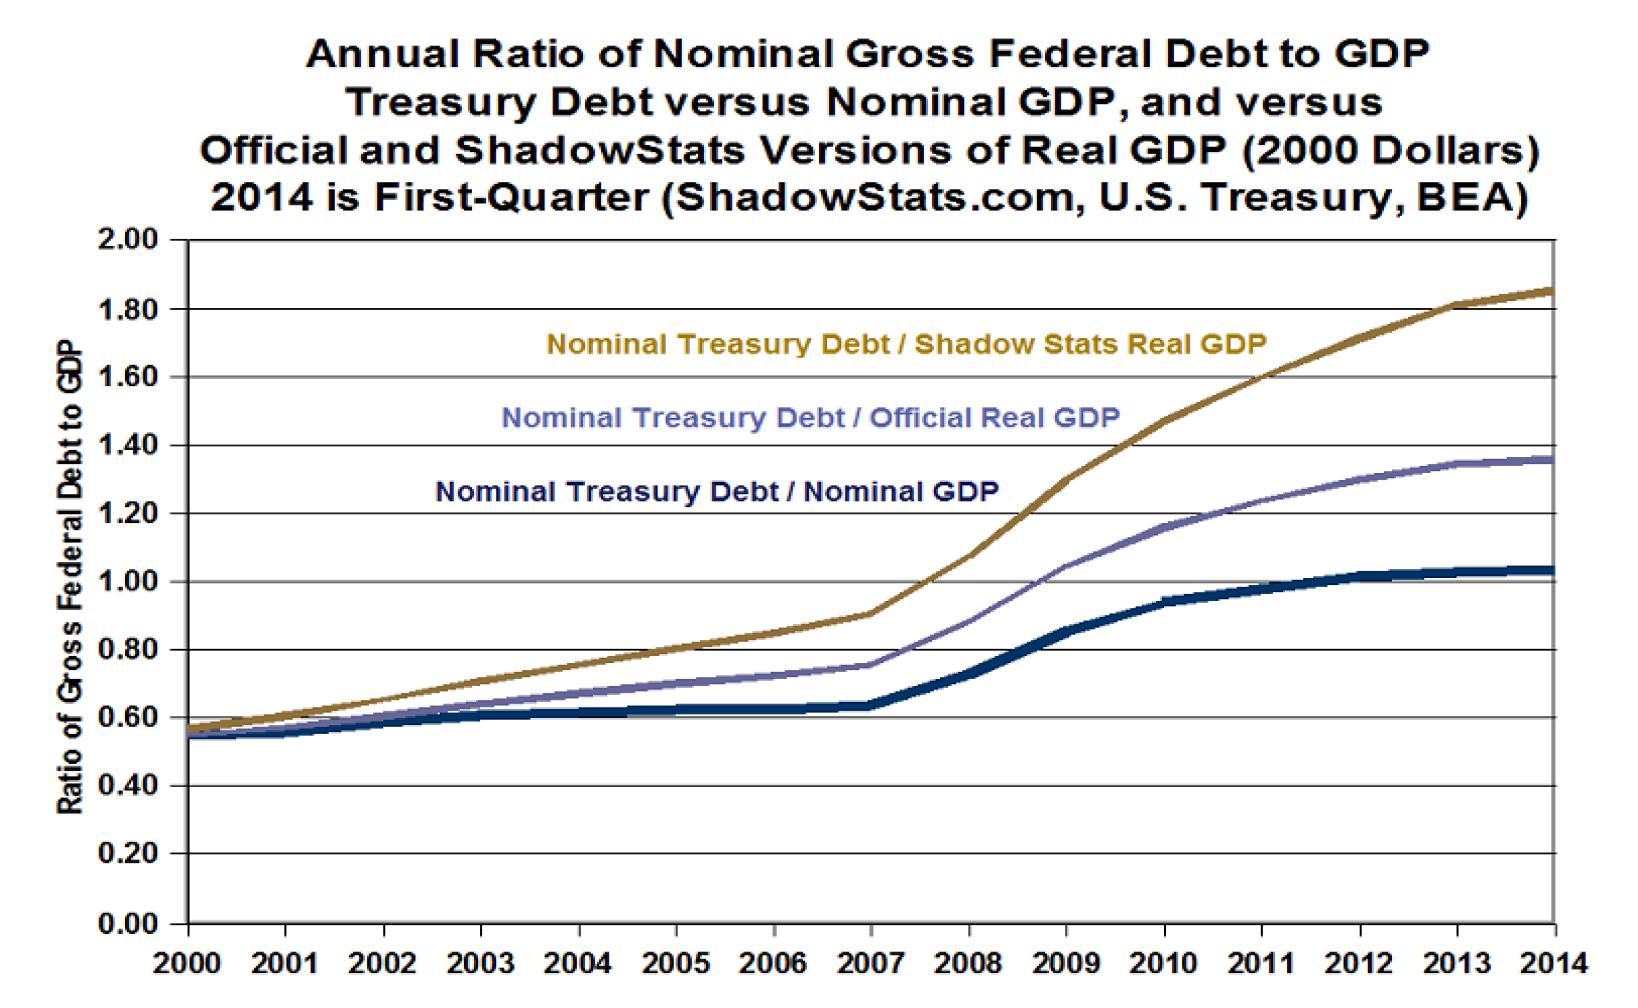
The graph below shows three different debt to GDP ratios. The bottom line is nominal debt to nominal GDP, the financial press ratio. The middle line is the ratio of nominal debt to the official measure of real GDP. The top line is the ratio of nominal GDP to Shadowstats’ corrected measure of real GDP that puts back in some of the inflation that is no longer included in official measures. The basis for this corrected measure is also 2000, but as the GDP number for 2000 is lower due to correction, this graph begins with the ratio at a slightly higher point.


The nominal debt to GDP ratio shows that as of the end of the first quarter of 2014 total US Treasury debt outstanding is 103 percent of US GDP.

The ratio of Treasury debt to official real GDP shows debt at 136% of GDP.

The ratio of debt to real GDP deflated with more a more realistic measure of inflation, one more in keeping with the experience of consumers, puts US public debt at 185% of GDP. In other words, the burden of US debt on the real economy is almost twice the burden that is normally perceived.

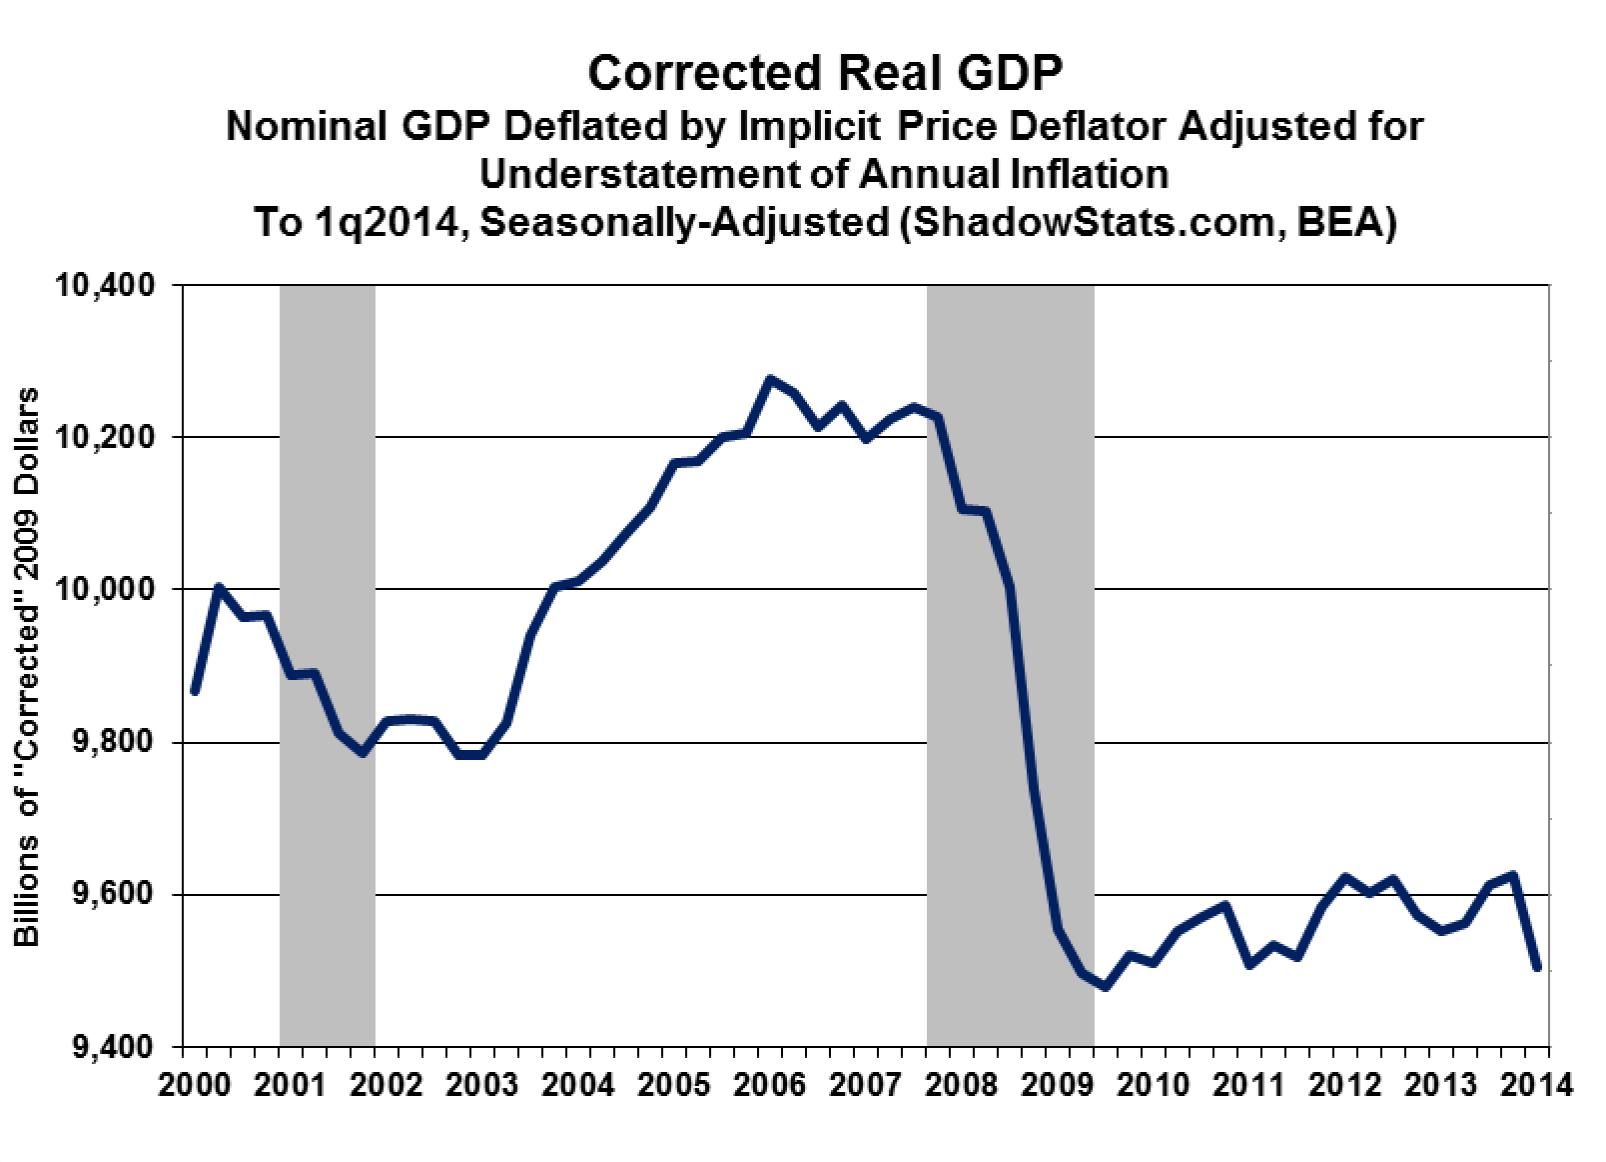
The Shadowstats adjustment we made to real GDP does not fully correct for what we believe has been a growing understatement of inflation since the 1980s. The adjustment we made corrects the implicit price deflator for a two-percentage point understatement of annual inflation due to hedonic distortion. Real GDP with this correction since 2000 looks like this:


We have calculated the ratios of US public debt to nominal GDP and to two measures of real GDP. The ratios of debt to GDP would be much higher if we used total credit outstanding, or total public and private debt, and if we used the government’s unfunded liabilities. The fact seems clear that debt is a major and unappreciated issue for the US economy. The enormous debt, especially with the middle class economy largely offshored, implies substantially lower living standards for the 99 percent.

The first quarter contraction, especially our corrected number, implies a second quarter negative real GDP. In other words, the years of Quantitative Easing (money printing) by the Federal Reserve has not resulted in economic recovery from the 2008 downturn and has not prevented further contraction.

Massive money creation and huge fiscal deficits have protected the balance sheets of “banks too big to fail” but have harmed the American people. Retirees and pension funds have been deprived for years of interest income as the Federal Reserve engineered zero or negative interest rates for the sake of a handful of oversized banks.

The extraordinary creation of new dollars diluted the dollars held by peoples, companies, institutions, and central banks throughout the world, raising fears that the dollar would lose exchange value and its role as world reserve currency.

Washington’s use of financial sanctions to force other countries to bend to Washington’s will is causing countries to leave the dollar payments system. Russian President Vladimir Putin’s advisor has said that the dollar must be crashed as the only way to prevent US aggression. The Chinese have called for “de-americanizing the world.”

The imperialistic US Foreign Account Tax Compliance Act (FATCA), which comes into full force July 1, 2015, imposes such heavy reporting costs on foreign financial institutions that these institutions might opt out of dollar transactions. All together, the result could be a serious tumble in the value of the US dollar, more wealth contraction, higher inflation via import prices, and less US wealth available to support US debt.

In view of this reality, why is Washington pushing its puppet in Kiev toward war with Russia? Why is Washington pushing NATO to spend more money and build more bases on which to deploy more troops in the Baltics and Eastern Europe, especially when Washington’s contribution will be the largest part of the cost? Why is Washington re-entering the Middle East conflict that Washington began by inciting Sunni and Shia against one another? Why is Washington constructing new naval and air bases from the Philippines to Vietnam in order to encircle China?

If Washington is this unaware of its budget constraints and its financial predicament, it cannot be long before Americans experience economic catastrophe.

Friday, January 17, 2014

Obama’s Numbers (January 2014 Update - FactCheck.org)

Latest statistics show stagnant wages, persistent long-term joblessness, soaring profits and stock prices, and moderating health care spending.
January 15, 2014 / FACTCHECK.org

Summary

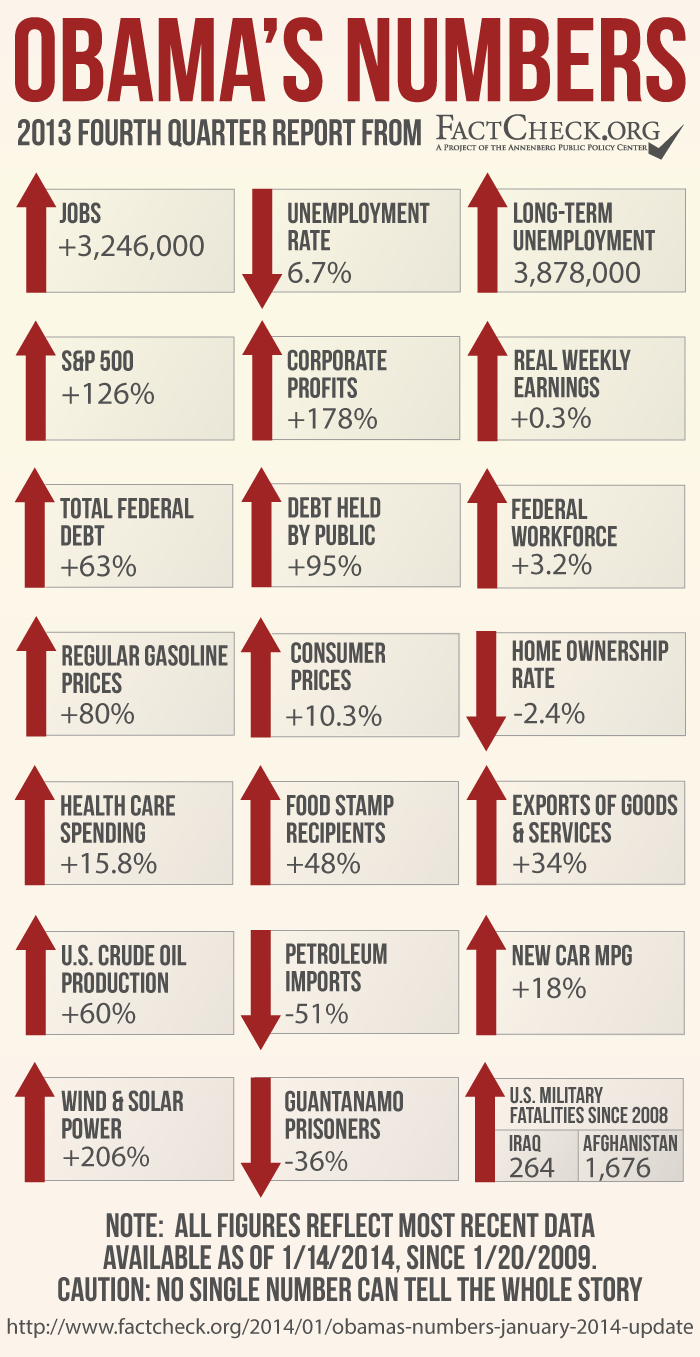
As we do every three months, we are updating our “Obama’s Numbers” report with fresh statistics reflecting what has happened since the president first took office.

Some highlights from this round:

The economy continues to gain jobs, but the number of long-term unemployed is nearly double what it was when Obama became president.

Wages remain stagnant,
increasing a scant 0.3 percent after inflation during Obama’s time. Meanwhile corporate profits are running 178 percent higher than just before he took office, and stock prices have doubled.

The number of low-income persons on food stamps remains just below the record level reached in 2012, with 15 percent of the population still getting benefits.

Health care spending has increased 15.8 percent under Obama, which is faster than inflation but modest by historical standards. But there’s scant evidence that the Affordable Care Act is causing the slowdown. The government economists and statisticians who track the spending said the law’s impact has been “minimal.”

U.S. exports have gone up just 34 percent — leaving the president far short of his announced goal of doubling them by the end of this year.

The number of suspected terrorists held prisoner at Guantanamo — which the president once ordered closed by January 2010 — is down only 36 percent.

The federal debt owed to the public has nearly doubled since Obama was sworn in, increasing by 95 percent.


Analysis

This report follows our October 2013 update and previous quarterly reports dating back to our first “Obama’s Numbers” article in October 2012. All figures here reflect the most recent available as of Jan. 14.


Jobs

As of December, the economy had gained a net total of 3,246,000 jobs since Obama first took office, and the unemployment rate had fallen to 6.7 percent, down from 7.8 percent. But that's a misleading stat.

Despite the gains, more than 10 million people remained unemployed, including 3.9 million who had been out of work for 27 weeks or longer. That’s an increase of nearly 1.2 million “long-term unemployed” since the start of the Obama presidency.

The average time that an unemployed person in December had been looking for work was 37 weeks, nearly double the average at the time Obama entered the White House.

Another troubling jobs statistic is the civilian labor force participation rate, which has now declined by 2.9 percentage points since Obama became president, to the lowest point since 1978. But that’s not entirely due to discouraged workersdropping out because they believe no jobs are available, as some Obama critics would have you believe.

Other labor-force dropouts include members of the baby-boom generation, who are retiring in droves. They also include disabled workers gaining Social Security disability benefits (a number that has doubled in the past 17 years, and is up 20 percent just since Obama took office).

There’s a lively debate among economists about the causes — and implications — of the shrinking participation rate, which started long before Obama took office. The rate actually peaked in early 2000 and declined 1.5 percent under Obama’s predecessor. A Labor Department economist, looking at current demographic trends, predicts further declines through at least 2022 — long after the end of Obama’s presidency.


Slowing Health Care Costs

Health care costs have risen only moderately since Obama took office, but not for the reason the White House wants you to think.

The most recent official figures were posted by the Centers for Medicare & Medicaid Services, whose nonpartisan economists and statisticians have tracked health care spending since 1960. CMS officials also published their findings in a Jan. 6 article in the journal Health Affairs.

The figures show health care spending in the U.S. rose 3.7 percent in 2012, and stood 15.8 percent higher than it did in 2008, the year before Obama took office.

That’s moderate by historical standards. And the White House was quick to claim credit.

Jason Furman, chairman of the president’s Council of Economic Advisers, published an op-ed piece in the Wall Street Journal Jan. 6 under the headline, “ObamaCare Is Slowing Health Inflation.” In the body of the piece, he argued that the slowdown in health costs is due “in part” to the Affordable Care Act, which he said is making a “meaningful” contribution. He cited, for example, the law’s provision penalizing hospitals if too many patients need to be readmitted, which he said has helped reduce hospital readmission rates by more than 1 percentage point.

But the nonpartisan number-crunchers at CMS said in their Health Affairs article that the ACA had only a “minimal” impact on the slowdown in spending. The reasons they cited instead were:
The economic slowdown and subsequent sluggish recovery
Drops in some prescription drug costs brought about by the expiration of patents on several costly medications including Lipitor, Plavix and Singulair, which are now available in low-cost generic versions, and
A one-time reduction in Medicare payment levels to skilled nursing facilities.

The Health Affairs authors suggested the slowdown in health spending may only be temporary, as has been the case after past recessions.


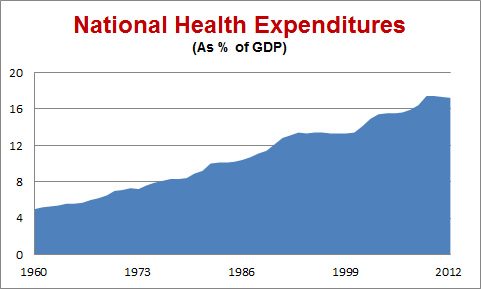
Health care spending consumed a record 17.4 percent of the nation’s entire economic output in the recession-plagued year of 2009. That declined only slightly, to 17.2 percent, in 2012.

“[T]his pattern is consistent with historical experience when health spending as a share of GDP often stabilizes approximately two to three years after the end of a recession and then increases when the economy significantly improves,” the authors said.

To conclude that the slowdown is permanent, they said, would require “more historical evidence.”


Moderate Inflation

Other costs have risen even more slowly under Obama. As of November, the Consumer Price Index has risen 10.3 percent since he first took office. Some policymakers even worry the inflation rate might be too low — foreshadowing sluggish economic growth in the future.

The highly visible (and highly volatile and highly politicized) price of regular gasoline stood at a national average of $3.33 per gallon in the week ended Jan. 13. That’s more than half a buck cheaper than it was in September 2012, when Republicans were making it an election issue. The recent price is 80 percent higher than it was when Obama took office in the midst of a worldwide recession, which had dampened demand. But the price under Obama has never equaled the historic high of more than $4 per gallon that it reached in June and July 2008, before he took office.


Disappointing Exports

The president has a long way to go to meet his goal of doubling exports of U.S. goods and services, which he first made in his 2010 State of the Union address. So far, exports have increased only 33.6 percent since Obama took office, according to data from the U.S. Commerce Department. (We compared seasonally adjusted figures for the fourth quarter of 2008 with those for the July – September quarter of 2013, the most recent figures available.)

Obama is facing the same global economic headwinds that he did six months ago, when we last updated the export figure. Simply put, overseas customers are still struggling. European unemployment is stuck at 12 percent, for example. And China’s economic growth has slowed and remains problematic. The president mentions his 2010 National Export Initiative on occasion. But at the current rate he won’t come close to meeting his original goal of doubling exports by the end of 2014.


Rising Federal Debt

The president is fond of boasting that annual federal deficits are falling rapidly. But they remain large by historical standards. And the fact is, they are piling up.

Total federal debt now stands at nearly $17.3 trillion, which is 63 percent higher than when Obama took office. That figure includes money the government owes to itself, chiefly through the Social Security trust funds.

A figure that economists consider more important — the debt the government owes to the public — has risen even more dramatically. That figure now stands at $12.3 trillion, an increase of 95 percent under Obama. At the current rate it will surely rise to a doubling during Obama’s presidency — possibly by the time of our next update three months hence.

Net interest payments consumed 6.4 percent of all federal spending in the fiscal year that ended Sept. 30. And the nonpartisan Congressional Budget Office officially projects that interest payments will gobble up an even bigger share of federal spending in the future. “CBO expects interest rates to rebound in coming years from their current unusually low levels, sharply raising the government’s cost of borrowing,” CBO said in its most recent long-term budget outlook document.


Government Workers

While cash-strapped state and local governments have been laying off teachers, firefighters, police and other workers, the federal government has increased the number of its employees under Obama.

The most recent figures from the Bureau of Labor Statistics show that as of December, workers on the federal payroll (excluding postal workers) numbered more than 2.1 million, up 3.2 percent since January 2009.

During the same time, the number of workers on state payrolls went down 3 percent and those on local government payrolls declined by 3.5 percent. A big reason for the disparity is that state and local governments generally must balance their spending and income each year, while the federal government can keep up spending by borrowing.

The figures also show that in recent months state and federal governments have been able to hire back some of their laid-off workers. Obama’s hiring spree also peaked in 2011 (ignoring spikes in hiring of temporary Census workers in 2010), and the number of non-postal federal workers has gone down more or less steadily during the budget battles of the past two years. But the number is above where it was when he took office.


Stagnant Wages, Record Corporate Profits

The divide between the affluent and ordinary wage earners — which the president last month called the “defining challenge of our time” — has widened during his time in office.

Wages remain stagnant, barely keeping up with inflation. Average weekly earnings of workers on payrolls, measured in inflation-adjusted dollars, have edged up a scant 0.3 percent between Obama’s first month in office and November 2013, the most recent on record. And there’s no clear upward trend. We reported a 0.1 percent increase in the real earnings figure in our July update six months ago, but that had evaporated by the time of our October update three months later, when the figure was exactly zero.

Relatively fewer people now own their own homes. Under Obama, the home ownership rate has declined by 2.4 percentage points, to 65.1 percent in the July-September quarter, according to U.S. Census figures. (The decline actually began in 2004, when the rate peaked at 69.4 percent as the housing bubble was inflating.)

And the number of low-income persons on food stamps (now called Supplemental Nutrition Assistance, or SNAP) continues at near-record levels. The most recent figures from the Department of Agriculture put the number receiving benefits at just over 47.4 million as of October — or 15 percent of the entire U.S. population.

That’s down a bit from the nearly 47.8 million record set in December 2012. But it is still an increase of 48.3 percent during Obama’s presidency.

The increase in food stamp beneficiaries is due partly to economic pressures, but also to liberalizations in both benefits and eligibility under President Obama and also under his predecessor. We covered those in some detail back in 2012 when GOP presidential candidate Newt Gingrich accused Obama of being the “food stamp president.” The number of food stamp beneficiaries increased by 14.7 million during Bush’s two terms in office, and is up another 15.4 million under Obama.

One factor behind Obama’s increase is that benefit levels were raised in 2009 as part of his economic stimulus program. That “temporary” increase was extended several times, and didn’t lapse until Nov. 1 last year.

But while wage earners and low-income people struggle, corporate profits keep setting records. Even after taxes, corporate profits were running at an annual rate of nearly $1.9 trillion in the July-September quarter of last year, the most recent for which figures are available. That’s nearly triple the rate during the three months before Obama became president — an increase of 178 percent.

To be sure, that last quarter of 2008 was the worst since 2002, thanks to the worst business recession since the Great Depression. But profits rebounded to well above previous levels. Profits in the most recent quarter were running 33 percent higher than the highest level seen before 2009, which was the third quarter of 2006, when profits ran at a rate of $1.4 trillion.

Obama’s time in office also has been good for those who own corporate stocks — whose values have doubled and more under Obama. As of the close of the market on Jan. 14, the Standard & Poor’s 500 stock index was 128 percent higher than it was when Obama first took office.

Other market indicators also have soared. The Dow Jones Industrial Average was up 106 percent, and the NASDAQ Composite index had nearly tripled, rising by 190 percent.


Booming Oil, Gas, Wind and Solar

The remarkable and historic boom in U.S. oil and gas production continues. Production of crude oil in the U.S. now has increased 60 percent since Obama took office, while imports of foreign oil and petroleum products have declined by 51 percent, as measured by the most recent Energy Information Administration figures, comparing the most recent three-month period with the last quarter of 2008.

As a consequence, U.S. dependency on imported oil has dropped sharply. The nation imported 34 percent of what it consumed in the first 11 months of 2011, according to the most recent EIA figures. (See Table 3.3a, “net imports” as a percent of “product supplied.”) That’s a drop of 23 percentage points from 2008, when the U.S. imported 57 percent. The decline actually began in George W. Bush’s second term, after U.S. dependency peaked at 60.3 percent in 2005. But the trend has gathered momentum under Obama.

As we’ve said before, the U.S. energy boom is a result primarily of the use of new drilling technology by the industry, not of any policy changes in Washington. But the president hasn’t been in any hurry to impose restrictions on the hydraulic fracturing method. The Environmental Protection Agency has been studying the impact of “fracking” on drinking water for years. It announced the study March 18, 2010, and issued a “progress report” Dec. 21, 2012. The EPA says it expects a draft report to be released for scientific peer review sometime this year.

Another factor behind reduced U.S. dependency on imported oil is more fuel-efficient automobiles. The latest figures from the University of Michigan’s Transportation Research Institute show the average EPA city/highway “window sticker” mileage of cars and light trucks sold in December was 24.8 miles per gallon, an improvement of 18 percent over the average for vehicles sold in the month that Obama took office.

Washington is now calling for even greater efficiency in the future. The Obama administration has put in place requirements that cars and light trucks average 54.5 mpg by model year 2025. But it remains to be seen whether the industry can produce such vehicles and get Americans to buy them, and whether future presidents will stick to Obama’s ambitious goal.

Under Obama, wind and solar power has tripled. In the most recent 12 months on record (ending in October) electricity generated by wind and solar had increased by 206 percent over the total for 2008. That was spurred in part by large federal tax subsidies for wind and solar generation.

Despite the large percentage increase in wind and solar generation, such energy accounted for just under 3.2 percent of all electricity generated in the U.S. in the July-September quarter of 2013, the most recent on record. Coal still accounts for the biggest share, followed by natural gas and nuclear power.

War and Terrorism

The detention facility for suspected terrorists remains open at the Guantanamo Naval Base in Cuba, despite the order Obama signed two days after taking office, directing that it be closed within one year. On Dec. 31 the U.S. announced it was releasing three more prisoners — all ethnic Uighur Chinese nationals — and transferring them to Slovakia, which had agreed to resettle them. But that leaves 155 “detainees” in custody (the Pentagon prefers not to call them “prisoners”), a number just 36 percent below the 242 who were being held nearly five years ago when Obama became president.

And the war in Afghanistan grinds on. According to official Pentagon figures, the U.S. has suffered a total of 1,676 military fatalities since 2008 in Operation Enduring Freedom.

Since 2008, a total of 264 U.S. military fatalities were attributed to the two Iraq war operations, Operation Iraqi Freedom and Operation New Dawn, according to official Pentagon figures. Although the last U.S. troops left Iraq at the end of 2011, two deaths were attributed to the conflict in 2012: Marine Staff Sgt. Oscar Eduardo Canon, who died in February 2012 of wounds suffered earlier, and Army Staff Sgt. Ahmed Kousay al-Taie, who had been missing since 2006 and whose remains were identified in February 2012.

– by Brooks Jackson
Sources

Bureau of Labor Statistics. “Employment, Hours, and Earnings from the Current Employment Statistics survey (National); Total Nonfarm Employment, Seasonally Adjusted.” Data extracted 14 Jan 2014.

Bureau of Labor Statistics. “Labor Force Statistics from the Current Population Survey; Unemployment Rate, Seasonally Adjusted.” Data extracted 14 Jan 2014.

Bureau of Labor Statistics. “Labor Force Statistics from the Current Population Survey; Unemployment Level, Seasonally Adjusted.” Data extracted 14 Jan 2014.

Bureau of Labor Statistics. “Labor Force Statistics from the Current Population Survey; Number Unemployed for 27 Weeks & Over, Seasonally Adjusted.” Data extracted 14 Jan 2014.

Bureau of Labor Statistics. “Labor Force Statistics from the Current Population Survey; Labor Force Participation Rate, Seasonally Adjusted.” Data extracted 14 Jan 2014.

Bureau of Labor Statistics. “Labor Force Statistics from the Current Population Survey; Not in Labor Force, Searched For Work and Available, Discouraged Reasons For Not Currently Looking, Unadjusted.” Data extracted 14 Jan 2014.

Social Security Administration. “Number of Social Security recipients—time series for selected benefit type: Disabled Workers.” Data extracted 14 Jan 2014.

Klein, Matthew C. “Is Jobless Rate Really Falling?” Bloomberg News. 9 Jan 2014.

Toossi, Mitra. “Labor force projections to 2022: the labor force participation rate continues to fall.” Monthly Labor Review. Dec 2013.

Martin, Anne B. and Micah Hartman, Lekha Whittle, Aaron Catlin and the National Health Expenditure Accounts Team. “National Health Spending In 2012: Rate Of Health Spending Growth Remained Low For The Fourth Consecutive Year.” Health Affairs. Jan 2014.

Furman, Jason. “ObamaCare Is Slowing Health Inflation.” Wall Street Journal. 6 Jan 2014.

Petrof, Alanna. “Euro zone unemployment at 12%, while U.S. improving.” CNN Money. 8 Jan 2014.

China’s Stocks Fall to Five-Month Low on Economic Growth Concern.” Bloomberg News. 5 Jan 2014.

White House. “Remarks by the President in the State of the Union.” 27 Jan 2010.

Bureau of Labor Statistics. “Consumer Price Index – All Urban Consumers.” Data extracted 14 Jan 2014.

Inflation, Strangely Low, Holds Key to 2014 Fed Policy.” Thompson/Reuters. 12 Jan 2014.

U.S. Energy Information Administration. “Weekly U.S. Regular All Formulations Retail Gasoline Prices.” Data extracted 14 Jan 2014.

Obama, Barack “Remarks by the President in State of the Union Address.” White House Office of the Press Secretary. 27 Jan 2010.

Petroff, Alanna. “Euro zone unemployment at 12%, while U.S. improving.” CNN Money. 8 Jan 2014.

China’s Stocks Fall to Five-Month Low on Economic Growth Concern.” Bloomberg News. 5 Jan 2014.

U.S. Treasury. “The Debt to the Penny and Who Holds It.” 10 Jan 2014. Data extracted 14 Jan 2014.

U.S. Treasury. “Final Monthly Treasury Statement of Receipts and Outlays of the United States Government For Fiscal Year 2013 Through September 30, 2013, and Other Periods.” Undated. Accessed 14 Jan 2014.

Congressional Budget Office. “The 2013 Long Term Budget Outlook.” Sept 2013.

Bureau of Labor Statistics. “Employment, Hours, and Earnings from the Current Employment Statistics survey (National); Government, Federal, except U.S. Postal Service, Seasonally Adjusted.” Data extracted 14 Jan 2014.

Bureau of Labor Statistics. “Employment, Hours, and Earnings from the Current Employment Statistics survey (National); Government, State Government, Seasonally Adjusted.” Data extracted 14 Jan 2014.

Bureau of Labor Statistics. “Employment, Hours, and Earnings from the Current Employment Statistics survey (National); Government, Local Government, Seasonally Adjusted.” Data extracted 14 Jan 2014.

Obama, Barack. “Remarks by the President on Economic Mobility.” White House Office of the Press Secretary. 4 Dec 2013.

Bureau of Labor Statistics. “Employment, Hours, and Earnings from the Current Employment Statistics survey (National); Average Weekly Earnings of All Employees, 1982-1984 Dollars.” Data extracted 14 Jan 2014.

U.S. Census Bureau. “Time Series: Seasonally Adjusted Home Ownership Rate.” Data extracted 14 Jan 2014.

U.S. Department of Agriculture, Food and Nutrition Service. “Supplemental Nutrition Assistance Program (Data as of January 10, 2014).” Data extracted 14 Jan 2014.

Plumber, Brad. “Food stamps will get cut by $5 billion this week — and more cuts could follow.” Washington Post Wonkblog. 28 Oct 2013.

Federal Reserve Bank of St Louis. “Corporate Profits After Tax (without IVA and CCAdj) (CP).” Data extracted 14 Jan 2014.

Google Finance. “S&P 500.” Historical prices. Accessed 14 Jan 2014.

Google Finance. “Dow Jones Industrial Average.” Historical prices. Accessed 14 Jan 2014.

Google Finance. “NASDAQ Composite.” Historical prices. Accessed 14 Jan 2014.

U.S. Energy Information Administration. “U.S. Crude Oil Production.” Accessed 14 Jan 2014.

U.S. Energy Information Administration. “Table 3.3a. Monthly Energy Review.” Dec 2013.

U.S. Energy Information Administration. “Table 1.1.A. Net Generation by Other Renewables: Total (All Sectors), 2003-April 2013.” Accessed 14 Jan 2014.

U.S. Environmental Protection Agency. “EPA Initiates Hydraulic Fracturing Study: Agency seeks input from Science Advisory Board.” News release. 18 Mar 2010.

U.S. Environmental Protection Agency. “EPA Releases Update on Ongoing Hydraulic Fracturing Study.” News release. 21 Dec 2012.

University of Michigan Transportation Research Institute. “Average sales-weighted fuel-economy rating (window sticker) of purchased new vehicles for October 2007 through December 2013.” 8 Jan 2014.

Obama Administration Finalizes Historic 54.5 MPG Fuel Efficiency Standards.” News release, White House Office of the Press Secretary. 28 Aug 2012.

U.S. Energy Information Administration. “Electric Power Monthly: Table 1.1.A. Net Generation from Renewable Sources: Total (All Sectors), 2003-October 2013.” 20 Dec 2013.

U.S. Energy Information Administration. “Electricity Data Browser: Net Generation.” Data extracted 14 Jan 2014.

Closure Of Guantanamo Detention Facilities: Executive Order – Review and Disposition of Individuals Detained at the Guantanamo Bay Naval Base and Closure of Detention Facilities.” The White House. 22 Jan 2009.

U.S. Department of Defense. “Detainee Transfer Announced.” News release. 31 Dec 2013.

U.S. Department of Defense, Defense Casualty Analysis System. “U.S. Military Casualties – Operation Enduring Freedom (OEF) Casualty Summary by Month.” Data extracted 14 Jan 2014.

U.S. Department of Defense, Defense Casualty Analysis System. “U.S. Military Casualties – Operation Iraqi Freedom (OIF) Casualty Summary by Month.” Data extracted 14 Jan 2014.

U.S. Department of Defense, Defense Casualty Analysis System. “U.S. Military Casualties - Operation New Dawn (OND) Casualty Summary by Month.” Data extracted 14 Jan 2014.

Shapiro, Joseph. “Remembering Marine Sgt. Oscar Canon, A ‘Superstar.’ ” National Public Radio. 24 Feb 2012.

Missing U.S. soldier killed by Shiite group.” The Associated Press. 27 Feb 2012.

Thursday, August 8, 2013

The “New Economy” Is The No Jobs Economy


One of my most popular columns was about escaping from the Matrix existence in which Americans live. It is a world of disinformation and misinformation in which facts are fiction, and abstract theories are substituted for empirical reality.
Official government statistics are make-believe. The government makes inflation and unemployment disappear by how it defines inflation and unemployment, and it makes the economy grow by how it defines Gross Domestic Product. The definitional basis determines the statistical result.
For example, in his report on the official GDP revisions released July 31, John Williams (shadowstats.com) writes that “academic theories, often with strong political biases, have been used to alter the GDP model over the years, resulting in “Pollyanna Creep,” where changes made to the series invariably have had the effect of upping near-term economic growth.” In other words, definitional changes produce economic growth whether or not the economy produces economic growth.
Inflation is made to disappear by substituting lower priced items for higher priced items and by defining price rises as quality improvements. Thus, the higher prices don’t count as inflation.
Unemployment disappears by defining discouraged workers who cannot find employment as people who are no longer in the work force. 
They simply are disappeared out of the ranks of the unemployed. It reminds me of Punjab’s magic blanket in the old cartoon strip, “Little Orphan Annie.” Punjab disposed of problem people by covering them with his blanket, or perhaps it was a rug, and they disappeared.
Despite the absurdity of the government’s data, Wall Street awaits with baited breath each new release to decide whether markets should go up or down or stay the same. In other words, the financial markets themselves take guidance from make believe numbers. In short, capitalism is rudderless. It has no reliable indicators. Everything is rigged to support the Matrix which keeps the population in a stupor.
Certainly the monthly payroll jobs number is misconstrued and has undeserved influence. If the economy is down, a jobs number significantly higher than the approximately 130,000 new jobs required to stay even with population growth is seen as a beacon of recovery. But the number is so distorted, as John Williams explains, by shifting and unstable seasonal adjustments and an average monthly add-on of 52,000 jobs from the “birth-death” model that no one really knows what the number is. Only a statistician like John Williams who is very familiar with the government’s data procedures can make much sense from the official statistics.
I take a simpler approach. I look at where the reported jobs are alleged to be. In the 21st century, the jobs created by “the world’s largest economy” have been lowly-paid, non-tradable, domestic service third world jobs. Manufacturing and tradable professional service jobs such as software engineering have been moved offshore to low-wage, low-salary locations. The savings in labor costs have enriched corporate executives, Wall Street, and shareholders.
I have made this point monthly for many years, and it has had no effect on economists, policymakers, money managers, or financial markets, all of which continue in their make-believe world of make-believe reality.
Here we go, one more time. Of the 161,000 reported private sector jobs gained in July, 157,000 or 97.5 percent, are in non-tradable domestic services. A non-tradable service is a job that produces services that cannot be exported, such as waitresses, bartenders, hospital orderlies, retail clerks, warehousemen. Thus, no matter how large the number might be, it cannot reduce the huge US trade deficit. Most of these jobs are part-time jobs without health or pension benefits. People in these jobs tend to live hand-to-mouth. These jobs do not produce sufficient income to drive a consumer economy.
Of these 157,000 reported jobs, 63,000 or 40 percent are reported to be in trade, transportation, and utilities. Of these 63,000 jobs, 60,500 of them or 96 percent are in wholesale and retail trade.
Before we go to the next category, ask yourself if you believe that in an economy that has had no recovery, in which there are no new manufacturing or construction jobs, in which the labor force participation rate is down, in which shopping center parking lots are far from full, stores with such a poor sales outlook would hire so many people in July?
Financial activities account for 15,000 of the reported new jobs. The Federal Reserve accounted for 80 percent of these jobs and bill collectors for the rest.
Professional and business services accounted for 36,000 of the new reported jobs. About half of these jobs were temporary help services and services to buildings and dwellings.
Health care and social assistance accounted for 8,300 jobs of which ambulatory health care services comprised 80 percent.
Waitresses and bartenders contributed 38,400 jobs. I have previously noted the anomaly of a population without good employment prospects or rising incomes going out to eat and to drink more and more often, so often that waitresses and bartenders comprise each and every month a significant percentage of the new employees.
In her commissioner’s statement accompanying the jobs report, Erica Groshen acknowledges that 8,200,000 or 6 percent of the currently employed are “involuntary part-time workers” who cannot find full-time employment.
The July 2013 payroll employment level of 136,038,000 stands 2,018,000 below the employment level in January 2008, which was 5 years and 7 months ago. If it requires 130,000 new jobs each month to keep employment equal with population growth, the US economy is behind by 10,728,000 jobs. These missing jobs show up in the declining labor force participation rate and the large number of discouraged workers who are no longer counted as unemployed.
Obviously, there is no economic recovery, despite the reporting of such by the presstitute financial press. Most likely the US economy is sinking further into a depression. The numerous indicators of economic collapse are ignored by economists and financial media busy at work weaving the Matrix to support The Lie.
As former executives of the “banks too big to fail” and their proteges run the US Treasury, the financial regulatory agencies, and the Federal Reserve, US economic policy has been focused on bailing out the excessively large banks created by mindless deregulation. The purpose of US economic policy is to save the large banks from their bad bets on poorly understood new financial instruments in the gambling casino created by deregulation.
The architects of financial deregulation, such as former Senator Phil Gramm and President Bill Clinton were rewarded for their service with fortunes of their own. The free market dupes, who aided and abetted Bill and Phil and misrepresented the repeal of financial stability as a new beginning for laissez faire capitalism, still pretend that the crisis resulted from Congress requiring banks to make mortgage loans to poor black people who could not pay.
The lack of reality in America is extreme. I do not believe anything like it has ever existed in the modern world. Essentially, no one in government or out understands anything.
The combination of the power of vested interests with ideological thinking remote from empirical reality is destroying the US economy and the economic prospects of the American people. The employment profile of the US economy is increasingly that of a third world country. Economic security, except for the rich, has disappeared. A large and growing percentage of the population experiences the insecurity of poverty or near-poverty, while the waiting lists for $50 million yachts expands. The distribution of income is so skewed upward that people of enormous wealth bid up the prices of used Ferraris from the 1950s and 1960s to $12,000,000 and $35,000,000. I can remember when a used Ferrari was something that a person with a moderate income could afford to purchase. I have a friend who bought and sold for $9,000 in the 1960s the Ferrari that last sold for $35 million.
Detroit, once the fourth largest American city and the manufacturing powerhouse of the world, is bankrupt. The populations of the cities that once were America’s thriving manufacturing base are declining. Cleveland has boarded up homes. St. Louis has 20 percent of its homes vacant. Welfare is under attack by the Republicans and even some Democrats as the plight of the population worsens and despair rises.
Washington only responds to the half dozen powerful, rich private interest groups that fund election campaigns. The American people have no one to represent them. The American people have been placed outside the system of “democratic capitalism” which is only for the one percent.
As Jeffrey St. Clair has made clear, America no longer has a left-wing. America is a right-wing world in which people, including “progressives” have been brainwashed into perceiving reality in racial contrast: the whites are well off and the blacks are poor and destitute.
This is the false reality of the Matrix. As whites are a larger percentage of the population than blacks, there are more poor whites than poor blacks. Moreover, the percentage of poor whites is growing. The way the jobs-offshoring, bail out the rich, US economy operates today makes every one poor, including the remnants of America’s once flourishing middle class. It is not a racial issue. It is a class issue. A few people have the power, and they are driving everyone else into the ground. The US government is their agent.
So go wave the flag, support the troops, believe the government’s and media’s lies, but unless you are the well-connected one percent, don’t expect any future for your children. You have been sold out by “your” government. Obama is making pretty speeches, but only the stupid will be fooled.

Monday, October 29, 2012

The Virtual Recovery


October 29, 2012 | Paul Craig Roberts

Since mid-2009 the US has been enjoying a virtual recovery courtesy of a rigged inflation measure that understates inflation. The financial Presstitutes spoon out the government’s propaganda that prices are rising less than 2%. But anyone who purchases food, fuel, medical care or anything else knows that low inflation is no more real that Saddam Hussein’s weapons of mass destruction or Gadhafi’s alleged attacks on Libyan protesters or Iran’s nuclear weapons. Everything is a lie to serve the power-brokers.

During the Clinton administration, Republican economists pushed through a change in the way the CPI is measured in order to save money by depriving Social Security retirees of their cost-of-living adjustment. Previously, the CPI measured the change in the cost of a constant standard of living. The new measure assumes that consumers adjust to price increases by lowering their standard of living by substituting lower quality, lower priced items. If the price, for example, of New York strip steak goes up, consumers are assumed to substitute the lower quality round steak. In other words, the new measure of inflation keeps inflation down by reflecting a lowered standard of living.

Statistician John Williams (shadowstats.com), who closely follows the collecting and reporting of official US economic statistics, reports that consumer inflation, as measured by the 1990 official government methodology has been running at about 5%. If the 1980 official methodology for measuring the CPI is used, John Williams reports that the current rate of US inflation is about 9%.

The 9% figure is more consistent with people’s experience in grocery stores.

Officially the recession that began in 2007 ended in June 2009 after 18 months, making the Bush Recession the longest recession since World War II. However, John Williams says that the recession has not ended. He says that only the GDP reporting, distorted by an erroneous measurement of inflation, shows a recovery. Other, more reliable measures of economic activity, show no recovery.

Williams reports that the economy began turning down in 2006, falling lower in 2008 and 2009, and bottom-bouncing ever since. Not only is there no sign of any recovery, but “the economic downturn now is intensifying once again.” The absence of an economic recovery “is evident in the [official] reporting of nearly all major economic series. Not one of these series shows a pattern of activity that confirms the recovery [shown] in the GDP series.”

Williams concludes that “the official recovery simply is a statistical illusion created by the government’s use of understated inflation in deflating the GDP.” In other words, the reported gains in GDP are accounted for by price increases, not increases in real output.

The result of the US government’s economic deception is the same as the deception Washington has used to start wars all over the Middle East. The government propaganda produces a make-believe virtual reality that bears no relationship to real reality. In history there have been many governments who have prevailed by deceiving the people, but Washington has moved this success to a new peak. As long as Americans believe anything Washington says, they are doomed.

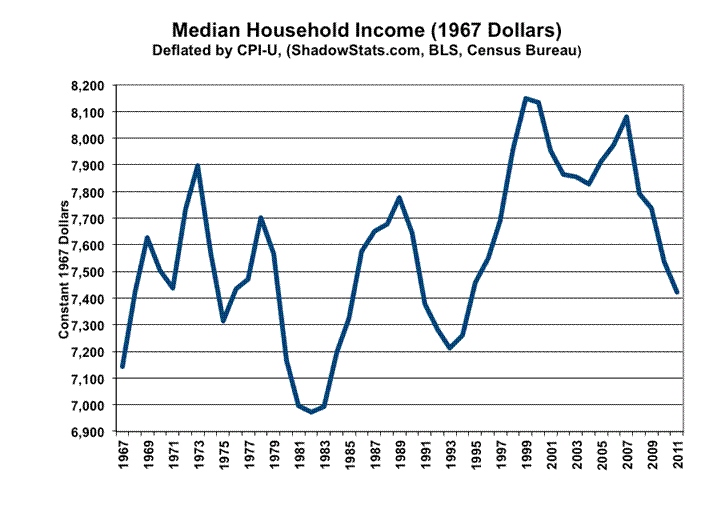
It is easy to see why there is no economic recovery and cannot be an economic recovery. Look at the chart below (courtesy of John Williams, shadowstats.com).


Real median household income at the end of 2011 is back where it was in 1967-68. Moreover, Williams has deflated household income to get its real value by using the official inflation measure, which substantially understates inflation. If Williams had used the 1990 or 1980 official government methodology for calculating the consumer price index, the real median incomes of households would show a larger decline.

Moreover, the low 2011 real median household income is the summation, in most cases, of two household earners, whereas in 1967-68 one earner could produce the same real income. As Nobel economist Gary Becker, my former colleague as Business Week columnist, pointed out, when both husband and wife have to work in order to maintain the same purchasing power, household income from the wife’s in-kind household services is eliminated. Therefore, the monetary measure of the dual household income overstates income, because it is not adjusted for the lost benefits formerly provided by the wife who at home managed the household.

Americans are far more oppressed by the power brokers in Washington than statistics display. Moreover, the young are born into the oppressive, exploitative American system and do not know any different. They are fed by the Presstitute media with endless propaganda about how fortunate they are and how indispensable their wonderful country is. Americans are kept in a constant state of amusement, and many never grasp the loss of their civil liberties, job and career opportunities, and respect that the US won during the decades-long cold war with Soviet Communism.

On September 13, Federal Reserve Chairman Ben “Helicopter” Bernanke announced Quantitative Easing 3. Bernanke said that the recovery is weak and needs more Fed stimulus. He said the Fed will purchase $40 billion of mortgage bonds per month in order to drive interest rates further below the rate of inflation and help to sell more houses.

But how do you sell houses to households who are getting by with 1967-68 levels of real income and who have absolutely no job security? Their company can be taken over and offshored tomorrow or they can be replaced by foreign workers on H-1B visas. Housing prices have dropped, but not to 1967-68 levels.

Bernanke’s announcement that the Fed’s purchase of mortgage bonds is to spur housing and the economy is disinformation. Bernanke is purchasing the bonds in order to boost the values of the derivatives and debt instruments in the banks’ portfolios. Lower interest rates raise the value of the debt instruments on the banks’ balance sheets. By depriving American savers of a real interest rate on their savings, Bernanke makes the busted banks look solvent.

This is what is happening in “freedom and democracy” America. The vast majority of Americans, especially the retired, are forced to consume their savings and draw down their capital because they can get no real interest on their savings. The beneficiaries are the banksters, who can borrow at near zero interest rates, charge consumers 16% on their credit cards, and use the Federal Reserve’s largess to speculate on interest rate swaps and credit default swaps. The American taxpayers hold the bag for the banksters’ uncovered gambles.

Would you not gamble if the American taxpayers had to cover your bets, but your winnings were yours alone?

The future of the American political order is in doubt. The Bush and Obama regimes have so badly abused the Constitution and statutory law, that the America that Ronald Reagan left to us no longer exists. America is on the path to collapse or tyranny.

Suppose that a miracle produces an economic recovery. What becomes of the enormous excess bank reserves that the Federal Reserve has provided the banks?

If these bank reserves are used for expanding loans, the money supply will outstrip the production of goods and services, and inflation will rise.

If the Fed tries to take the excess reserves out of the banking system by selling bonds, interest rates will rise, thus destroying the wealth of bond holders and draining liquidity from the stock market. In other words, another depression that wipes out the remaining American wealth.

The Federal Reserve’s announcement of QE3 shows that the Fed will continue to create new money in order to protect the values of the insolvent banks’ questionable assets. The Federal Reserve represents the banksters, not the American public. Like every other American government institution, the Federal Reserve is far removed from concerns about American citizens.

In my opinion, the Federal Reserve’s purchase of bonds in order to drive down interest rates has produced a bond market bubble that is larger than the real estate and derivative bubbles. Economically, it is nonsensical for a bond to carry a negative real interest rate, especially when the government issuing the bond is running large budget deficits that it seems unable to reduce and when the central bank is monetizing the debt.

The bubble has been protected by the euro “crisis,” which possibly is more of a virtual crisis than a real one. The euro crisis has caused money to seek refuge in dollars, thus supporting the dollar’s value even while the Federal Reserve prints money with which to purchase the never-ending flow of the governments’ bonds to finance trillion dollar plus annual budget deficits–about 5 times the “Reagan deficits” that Wall Street alleged would wreck the US economy.

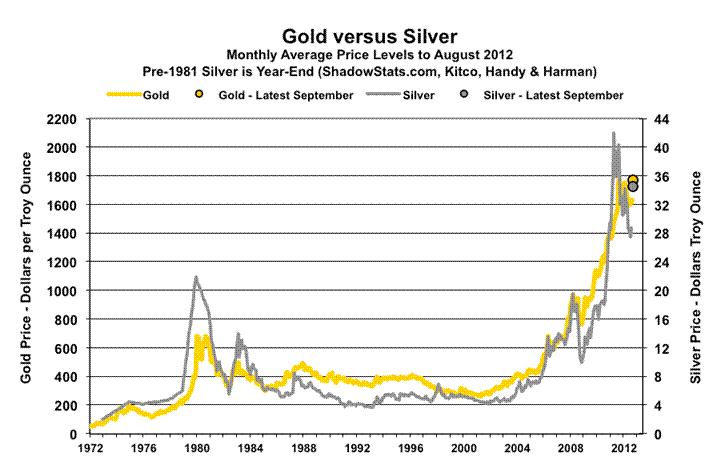
Indeed, the US dollar’s exchange value is itself a bubble waiting to pop. The sharp rise in the dollar price of gold and silver since 2003 indicates a flight from the US dollar. (The chart is courtesy of John Williams, shadowstats.com.)

The bond market bubble will pop if the dollar bubble pops. The Federal Reserve can sustain the bond market bubble by purchasing bonds, and there are no limits on the Federal Reserve’s ability to purchase bonds. However, the endless monetization of debt, even if the new money is stuck in the banks and does not find its way into the economy, can spook foreign holders of dollar-denominated assets.

Foreign central banks can decide that they want to hold fewer dollars and more precious metals as their reserves. Other countries, sensing the US dollar’s demise,


are organizing to conduct their trade without the use of the world’s reserve currency. Brazil, Russia, India, China, and South Africa intend to conduct their trade with one another in their own currencies. China and Japan have also negotiated to settle their trade balances with one another in their own currencies.

These agreements substantially reduce the use of the US dollar in international trade and, thus, the demand for dollars. When demand falls, so does price, unless the supply shrinks. But the Federal Reserve has announced, essentially, unlimited supply of US dollars. So we are faced with a paradox. The US dollar is supposed to remain valuable despite its enormous increase in supply

In addition, China, America’s largest creditor and in the past a reliable purchaser of US Treasury bonds, holds some two trillion in dollar-denominated assets, primarily Treasury bonds. How is Washington treating its largest foreign creditor? Not with appreciation or deference. Washington is surrounding China with naval and air bases, interfering in China’s disputes with other countries, and bringing contrived actions against China in the World Trade Organization. Washington claims that US corporations are deserting the US not because of the lower cost of labor in China, but because of Chinese “subsidies” to the relocated US firms.

In my April 30 column, “Brewing a Conflict with China,” I wrote that Washington would like to substitute a cold war with China for the hot wars in the Middle East. The problem with the hot wars is the loss of superpower face from Washington’s inability to prevail after eleven years, and although the hot wars are profitable for the military/security complex, the wars don’t generate the level of profits that would flow from a high-tech arms race with China. Moreover, Washington believes that diverting Chinese investment from the economy into a military buildup would slow the rate at which the Chinese economy is overtaking the US economy.

What if instead of taking the bait from Washington, China targets Washington’s Archilles heel–the dollar’s role as reserve currency–and decides it is cheaper to dump one trillion dollars of US Treasury debt on the bond market than to commit to a 30 year arms race? To keep the price of Treasuries from collapsing, the Federal Reserve could print the money to buy the bonds. But if China then dumps the printed one trillion dollars in the foreign exchange markets, Washington cannot print euros, British pounds, Russian rubles, Swiss francs, and other currencies in order to buy up the dollars.

Frantic, Washington would try to arrange currency swaps with foreign countries in order to acquire the foreign exchange with which to buy up the dollars that, otherwise, will drive down the dollar exchange rate and destroy the Federal Reserve’s control over interest rates.

But if the Chinese don’t want the dollars, will other countries want to swap their currencies for the abandoned US dollar?

Some of Washington’s puppet states will comply, but the wider world will rejoice in the termination of Washington’s financial hegemony and refuse the offer.

Sooner or later the dollar will collapse from Washington’s abuse of the dollar’s role as reserve currency, and the dollar will lose its “safe haven” status. US inflation will rise, and US political stability, along with America’s hegemonic power, will wane.

The rest of the world will sigh with relief. And China will have defeated the superpower without an arms race or firing a shot.

Monday, July 30, 2012

Nationalize Money, Not Banks

We Don’t Have To Be In Financial Crisis
Herman Daly
Emeritus Professor, University of Maryland School of Public Policy


If our present banking system, in addition to fraudulent and corrupt, also seems “screwy” to you, it should. Why should money, a public utility (serving the public as medium of exchange, store of value, and unit of account), be largely the by-product of private lending and borrowing? Is that really an improvement over being a by-product of private gold mining, as it was under the gold standard? The best way to sabotage a system is hobble it by tying together two of its separate parts, creating an unnecessary and obstructive connection. Why should the public pay interest to the private banking sector to provide a medium of exchange that the government can provide at little or no cost? Why should seigniorage (profit to the issuer of fiat money) go largely to the private sector rather than entirely to the government (the commonwealth)?

Is there not a better away? Yes, there is. We need not go back to the gold standard. Keep fiat money, but move from fractional reserve banking to a system of 100% reserve requirements. The change need not be abrupt—we could gradually raise the reserve requirement to 100%. Already the Fed has the authority to change reserve requirements but seldom uses it. This would put control of the money supply and seigniorage entirely with the government rather than largely with private banks. Banks would no longer be able to live the alchemist’s dream by creating money out of nothing and lending it at interest. All quasi-bank financial institutions should be brought under this rule, regulated as commercial banks subject to 100% reserve requirements.

Banks cannot create money under 100% reserves (the reserve deposit multiplier would be unity), and banks would earn their profit by financial intermediation only, lending savers’ money for them (charging a loan rate higher than the rate paid to savings or “time-account” depositors) and charging for checking, safekeeping, and other services. With 100% reserves every dollar loaned to a borrower would be a dollar previously saved by a depositor (and not available to the depositor during the period of the loan), thereby re-establishing the classical balance between abstinence and investment. With credit limited by saving (abstinence from consumption) there will be less lending and borrowing and it will be done more carefully—no more easy credit to finance the leveraged purchase of “assets” that are nothing but bets on dodgy debts.

To make up for the decline and eventual elimination of bank- created, interest-bearing money, the government can pay some of its expenses by issuing more non interest-bearing fiat money.

However, it can only do this up to a strict limit imposed by inflation. If the government issues more money than the public voluntarily wants to hold, the public will trade it for goods, driving the price level up. As soon as the price index begins to rise the government must print less. Thus a policy of maintaining a constant price index would govern the internal value of the dollar. The external value of the dollar could be left to freely fluctuating exchange rates.

Alternatively, if we instituted John M. Keynes’ international clearing union, the external value of the dollar, along with that of all other currencies, could be set relative to the “bancor,” a common denominator accounting unit used by the payments union. The bancor would serve as an international reserve currency for settling trade imbalances—a kind of “gold substitute”.

The United States opposed Keynes’ plan at Bretton Woods precisely because under it the dollar would not function as the world’s reserve currency, and the US would lose the enormous international subsidy that results from all countries having to hold large transaction balances in dollars.

The payments union would settle trade balances multilaterally. Each country would have a net trade balance with the rest of the world (with the payments union) in bancor units. Any country running a persistent deficit would be charged a penalty, and if continued would have its currency devalued relative to the bancor. But persistent surplus countries would also be charged a penalty, and if the surplus persisted their currency would suffer an appreciation relative to the bancor.

Keynes’ goal was balanced trade, and both surplus and deficit nations would be expected to take measures to bring their trade into balance. With trade in near balance there would be little need for a world reserve currency, and what need there was could be met by the bancor. Freely fluctuating exchange rates would also in theory keep trade balanced and reduce or eliminate the need for a world reserve currency. Which system would be better is a complicated issue not pursued here. In either case the IMF could be abolished since there would be little need for financing trade imbalances (the IMF’s main purpose) in a regime whose goal is to eliminate trade imbalances.

Returning to domestic institutions, the Treasury would replace the Fed (which is owned by and operated in the interests of the commercial banks). The interest rate would no longer be a target policy variable, but rather left to market forces. The target variables of the Treasury would be the money supply and the price index. The treasury would print and spend into circulation for public purposes as much money as the public voluntarily wants to hold. When the price index begins to rise it must cease printing money and finance any additional public expenditures by taxing or borrowing from the public (not from itself). The policy of maintaining a constant price index effectively gives the fiat currency the “backing” of the basket of commodities in the price index.

In the 1920s the leading academic economists, Frank Knight of Chicago and Irving Fisher of Yale, along with others including underground economist and Nobel Laureate in Chemistry, Frederick Soddy, strongly advocated a policy of 100% reserves for commercial banks. Why did this suggestion for financial reform disappear from discussion? The best answer I have received is that the great depression and subsequent Keynesian emphasis on growth swept it aside because limiting bank lending to actual savings was too restrictive on growth, which became the big panacea. Also there is the obvious vested interest of commercial banks in retaining the privilege of creating money and lending it at interest.

Now suppose for a moment that aggregate growth has begun to increase environmental and social costs faster than production benefits, thus becoming uneconomic growth. There is much evidence that this is the case. Then a financial constraint on growth (balancing investment with abstinence) would be much needed, and 100% reserves would be a good way to accomplish it. If, however, growth remains the summum bonum of the economy, then we will inevitably borrow against our hoped for larger future income to finance the investments needed to produce it.

Financing investment by saving would require less present consumption, which many will deem to be an unacceptable drag on growth. But real growth has encountered the biophysical and social limits of a “full world.” Financial growth is being stimulated ever more in the hope that it will pull real growth behind it, but it is in fact pushing uneconomic growth- — growth of ”illth.” Since illth is negative wealth it can hardly redeem the growing debt that is financing it.

The original 100% reserve proponents mentioned above were in favor of aggregate growth, but wanted it to be steady growth in wealth, not speculative boom and bust cycles. Soddy was especially cautious about uncontrolled physical growth, but his main concern was with the symbolic financial system and its disconnect from the real system that it was supposed to symbolize. The result was confusion between wealth and debt. One need not advocate a steady-state economy to favor 100% reserves, but if one does favor a steady state the attractions of 100% reserves are increased.

How would the 100% reserve system serve the steady-state economy?

  • First, as just mentioned it would restrict borrowing for new investment to existing savings, greatly reducing speculative growth ventures—for example the leveraging of stock purchases with huge amounts of borrowed money (created by banks ex nihilo rather than saved out of past earnings) would be severely limited. Down payment on houses would be much higher, and consumer credit would be greatly diminished. Credit cards would become debit cards. Long term lending would have to be financed by long term time deposits, or by carefully sequenced rolling over of shorter term deposits. Growth economists will scream, but a steady-state economy does not aim to grow, for the very good reason that growth has become uneconomic.
  • Second, the money supply no longer has to grow in order for people to pay back the principal plus the interest required by the loan responsible for the money’s very existence in the first place. The repayment of old loans with interest continually threatens to diminish the money supply unless new loans compensate. With 100% reserves money becomes neutral with respect to growth rather than biasing the system toward growth by requiring more loans just to keep the money supply from shrinking.
  • Third, the financial sector will no longer be able to capture such a large share of the nation’s profits (around 40%!), freeing some smart people for more productive, less parasitic, activity. 
  • Fourth, the money supply would no longer expand during a boom, when banks like to loan lots of money, and contract during a recession, when banks try to collect outstanding debts, thereby reinforcing the cyclical tendency of the economy.
  • Fifth, with 100% reserves there is no danger of a run on a bank leading to a cascading collapse of the credit pyramid, and the FDIC could be abolished, along with its consequent moral hazard. The danger of collapse of the whole payment system due to the failure of one or two “too big to fail” banks would be eliminated. Congress then could not be frightened into giving huge bailouts to some banks to avoid the “contagion” of failure, because the money supply is no longer controlled by the private banks. Any given bank could fail by making imprudent loans, but its failure, even if a large bank, would not disrupt the public utility function of money. The club that the banks used to beat Congress into giving bailouts would have been taken away.
  • Sixth, the explicit policy of a constant price index would reduce fears of inflation and the resultant quest to accumulate more as a protection against inflation. Also it in effect provides a multi-commodity backing to our fiat money.

Keynes bancor scheme or a regime of fluctuating exchange rates would automatically balance international trade accounts, eliminating large surpluses and deficits. Thus, there would no longer be any need for the International Monetary Fund and the austerity its “conditionality” imposes on weaker economies.

To dismiss such sound policies as “extreme” in the face of the repeatedly demonstrated failure and fraud of our current financial system is quite absurd. The idea is not to nationalize banks, but to nationalize money, which is a natural public utility in the first place. The fact that this idea is hardly discussed today, in spite of its distinguished intellectual ancestry and common sense, is testimony to the power of vested interests over good ideas. It is also testimony to the veto power that our growth fetish exercises over the thinking of economists today.