Showing posts with label income inequality. Show all posts

Tuesday, March 31, 2015

Why America’s inequality conversation is such a farce

Tuesday, Mar 31, 2015
“It’s your own damn fault!” The upcoming campaign is supposedly going to be about inequality. Here's why it's just another plutocratic charade
Elias Isquith

As I’ve noted previously, one of the stranger recent developments in American politics has been the swift arrival of a bipartisan consensus over economic inequality. For years and years — decades, even — the left and the right have quarreled over inequality’s very existence. But now, worrying about the maldistribution of income and wealth in the U.S. is utterly mainstream. Noting the widening chasm between the 1 percent and everyone else has become so anodyne, in fact, that even would-be presidents like Hillary Clinton, Jeb Bush, Ted Cruz, Rand Paul and Marco Rubio are doing it. It’s enough to make a longtime class-warrior think she’s winning.

That would be a mistake. Because although the political value of inequality is different today than was the case before the Great Recession, it’s mainly been rhetoric — and not policy — that has changed. We may talk more than we once did about the rich are, as Fitzgerald wrote, “not like you and me.” So far, very little’s been done on the national level to explicitly confront the problem. On the contrary, the economic recovery has been so full of McJobs that there’s reason to suspect the issue may only get worse in years to come.

But if the U.S. economy is just as iniquitous as ever, and if the near-total gutting of campaign finance regulation has made the U.S. political economy almost as plutocratic as ever, then how do we explain the rise of inequality as a mainstream topic of conversation? If the 1 and .01 percent still wields such a massively disproportionate degree of influence over our culture as well as our politics, wouldn’t talk of class remain verboten? Shouldn’t the super-rich be telling voters and the public in general to pay no attention to the moneybags behind the curtain?

You might think so; but that would only be true if the wealthy’s control of American politics was more direct (and ham-handed) than it actually is. As Noam Chomsky has argued, the way the wealthy and the powerful operate in a formal democracy is significantly different from how they act in an illiberal society. The discourse has its regulators and gate-keepers, of course. But rather than outright censorship, the powers-that-be in the U.S. tend to head-off opposition by setting the parameters of the debate — and doing so in such a way as to ensure their interests are never really threatened.

Noam Scheiber’s New York Times piece on Monday shows us what that process looks like in the real world. What we see in his report is a donor class that’s acquiesced to inequality being a major 2016 issue, partially because they’ve succeeded so far in rendering any serious responses to the problem out of the question. As Scheiber notes, strong majorities of Americans — including Republicans— are in favor of the government taking action to address the crisis, with redistribution from the 1 percent to the rest being an especially popular response. Yet for all their talk of inequality and opportunity, none of the declared or soon-to-declare presidential candidates of consequence have provided even a general endorsement of such a plan.

Unsurprisingly, their hesitation is shared by one significant group — donors. Citing the invaluable work of Benjamin Page, Jason Seawright and Larry Bartels, Scheiber notes that although a majority of the wealthy Chicago-area persons these researchers interviewed professed concern over inequality, too, they were dramatically less interested in any public policy solutions. “Only 13 percent of wealthy interview subjects” want to see government work to address the problem, Scheiber writes. And only 17 percent are supportive of policies that involve raising taxes on the rich.

And it’s not just tax hikes that the wealthy are keeping off the table. While two-out-of-three Americans think the government should help citizens find a job, provided they’re willing and able, fewer than one-out-of-five of wealthy respondents agree. “Forty percent of the wealthy,” Scheiber writes, want the minimum wage to be high enough to support a family; among the general public, support for that idea nearly doubles, coming out at 78 percent. Perhaps even more telling, though, is the way the overall philosophy of the very rich permeates the public discourse at large.

For example: According to interviews with the wealthy conducted by Fiona Chin, a Northwestern graduate student whom Scheiber describes as a Page “protégé,” the 1 percent is much more likely to believe that inequality is a byproduct of virtue and hard work, rather than any flaws in the U.S.’s economic system. The wealthy, Chin says, think inequality is “a story about individual hard work, effort and character.” Sure, the rich have some built-in advantages, they say. But they’re disadvantaged too; being born with means, after all, can make you less inclined to work.

If you didn’t strike it rich in America, these 1 percenters told Chin, it’s most likely because you “didn’t take advantage of the education system.” That, of course, is a euphemistic way of saying it’s your own damn fault. And while Scheiber’s report doesn’t bring up this angle directly, it’s not hard to see how there might be a connection between the 1 percent’s focus on education and the burgeoning movement to “reform” public schooling. A grand experiment in charter schools is fine. But reducing inequality by giving money to the people who need it? Not okay.

So we may now hear Bush — or Cruz, or Rubio, or Paul — talk about “opportunity” gaps; and we may soon listen as Clinton rails against cutting hedge fund managers’ taxes. But given the constraints the 1 percent establishes upfront, you can expect that most of the ideas to come from Bush, Rubio and, eventually, Clinton will differ little from what they would’ve proposed in the years before the Great Recession. And until they stop trying to sell the same-old policies under an inequality-themed banner, the politics of the issue will not be appreciably different. We’ll merely have transitioned from denial to a charade.

Low-wage jobs drive the recovery

By Ned Resnikoff -msnbc

It’s not uncommon to hear economics writers dismiss post-recession job growth as evidence of a “McJobs Recovery.” Sure, jobs may be slowly coming back, the argument goes, but not good jobs. Instead, employment growth seems to be largely concentrated in the sectors of the economy where wages are lowest.

That argument received some empirical ballast with the release of a report from the National Employment Law Project (NELP) that finds low-wage industries have grown at a disproportionately high rate since the end of the recession. The report’s author, policy analyst Michael Evangelist, finds that 44% of job growth since the end of the recession has been concentrated in industries where the median wage is $13.33 or less. That includes food service, retail, and administrative services (which includes jobs like security, maintenance, and janitorial work).

This is only the most recent in a series of NELP reports on the McJobs Recovery, all of which have found similar results. Evangelist told msnbc the consistency suggests this might be more than a hiccup on the road back to relative prosperity.

“Early on when we were doing these reports, we just speculated cyclical factors,” he said. “So one year into the recovery, consumer demand was growing and you’d see more growth in the restaurant food service industry.” But as food service continued to grow at a disproportionately high rate, NELP analysts came to see unbalanced growth as a more stable feature of the economic landscape.

“Now we’re five years into this and these are still the industries that are growing quickly,” said Evangelist.

Food service isn’t just one of the economy’s most fecund sectors: It’s also its most unequal, according to another report released last week by the left-leaning think tank Demos. In that study, Demos policy analyst Catherine Ruetschlin found that food services and retail had bigger worker-to-CEO compensation gaps than any other sector of the economy.

The steady encroachment of low-wage jobs may help to explain why median income in the United States has begun to stagnate even as the wealth of the country’s economic elite soars into previously unexplored altitudes. Last week, The New York Times reported that America no longer leads the world in median wealth, having been surpassed by Canada for the first time in at least decades.

Sunday, February 22, 2015

5 Facts That Show Half of America Is Seriously Struggling

The media celebrates "economic growth," while new data shows most Americans are barely surviving.

Happy Monday! S&P 500 now up 10% for year --CNN Money
Third-quarter U.S. economic growth strongest in 11 years --Reuters
The U.S. economy is on a tear --Wall Street Journal 


Half of our nation, by all reasonable estimates of human need, is in poverty. The jubilant headlines above speak for people whose view is distorted by growing financial wealth. The argument for a barely surviving half of America has been made before, but important new data is available to strengthen the case.

1. No Money for Unexpected Bills 

A recent Bankrate poll found that almost two-thirds of Americans didn't have savings available to cover a $500 repair bill or a $1,000 emergency room visit.

A related Pew survey concluded that over half of U.S. households have less than one month's income in readily available savings, and that ALL their savings -- including retirement funds -- amounted to only about four months of income.

And young adults? A negative savings rate, as reported by the Wall Street Journal. Before the recession their savings rate was a reasonably healthy 5 percent.

2. 40 Percent Collapse in Household Wealth 

Over half of Americans have good reason to feel poor. Between 2007 and 2013 median wealth dropped a shocking 40 percent, leaving the poorest half with negative wealth (because of debt), and a full 60% of households owning, in total, about as much as the nation's 94 richest individuals.

People of color fare the worst, with half of black households owning less than $11,000 in total wealth, and Hispanic households less than $14,000. The median net worth for white households is about $142,000.

3. Cost of Living Surges as Income Falls 

Official poverty measures are based largely on the food costs of the 1950s. But food costs have doubledsince 1978, housing has more than tripled, and college tuition is eleven times higher. The cost of raising a child increased by 40 percent between 2000 and 2010. And despite the gains from Obamacare, health care expenses continue to grow.

As all these essential costs have been going up, median household income has been going down since 2000, with the greatest drop occurring since 2009, as 95 percent of the post-recession income gains have gone to the richest 1%.

4. Lots of New Jobs (Below Living Wage) 

'Amazing' jobs report, apart from wages --Marketwatch 

Amazing at the top and at the bottom. According to the Federal Reserve Bank, there have been job gains at the highest paid level -- engineering, finance, computer analysis; and there have been job gains at thelowest paid level -- personal health care, retail, and food preparation.

But the jobs that kept the middle class out of poverty -- education, construction, social services, transportation, administration -- have seen a decline since the recession, especially in the northeast. At a national level jobs gained are paying 23 percent less than jobs lost.

Worse yet, the lowest paid workers, those in housekeeping and home health care and food service, haveseen their wages drop 6 to 8 percent (although wages overall rose about 2 percent in 2014).

5. Our Greatest Shame: Half of the Children Feeling Poverty 

Over half of public school students are poor enough to qualify for lunch subsidies. There's been a stunning70 percent increase since the recession in the number of children on food stamps. State of Working America reported that almost half of black children under the age of six are living in poverty.

The celebratory quotes about a booming economy seem so far away.

Tuesday, June 17, 2014

Income Inequality by State

http://www.reuters.com/subjects/income-inequality/list

What Makes the United States So Unequal?

By Robert J.S. Ross

If governments did nothing, Western Europe and the United States would have similar levels of inequality. But governments don’t sit on the sidelines. They collect taxes. They provide social programs. They take steps that can lessen the amount of market inequality. The difference: Governments in European and other high-income societies do much more to reduce inequality than the United States.

Comparisons among the high-income countries usually show the United States as the most unequal.

Comparisons of income inequality among the high income countries usually show the United States as the most unequal, as measured by a standard index called the Gini coefficient. A Gini value of 100 means that all the income is held by one household. A value of 0, on the other hand, means that all income is equally shared.

For the United States, the Gini coefficient runs about 38, according to the OECD, the economic policy tank for the rich countries, or about 48, according to the U.S. Census Bureau. The American Gini rating has risen sharply in the last generation, after falling gradually in the middle of the twentieth century.

By comparison, the Nordic countries– Sweden, Denmark, Norway – have among the lowest Gini coefficients, in the 25-27 range, while Germany has a Gini of 29 and France, 28.

Comparisons that show the United States as the most unequal of high-income societies typically take into account the income households have from market-based activity (work and investments) and government transfer programs (Social Security and unemployment compensation, for instance) and subtract away taxes. Researchers call the end result from these calculations “post tax and transfer” or “disposable” income.

Political decisions determine taxes and transfers. Public policies, everything from minimum wage to labor laws, also influence market-based income. So we should expect inequality levels to differ among developed nations. Even so, the actual differences among developed nations can be surprising.
Political decisions determine taxes and transfers.

On the yardstick of market-based income, the level of inequality in the United States does not come off as particularly extreme. The United States ranks eighth most unequal among the 26 countries that reported 2010 data to the OECD. The United States sports about 7 percent more market-based inequality than the average of all OECD nations.

The extreme inequality status of the United States only kicks in when we go beyond market-based income and look at tax and transfer policies.

In the United States, taxes and transfers are doing much less to reduce inequality than these policies are doing in other developed nations. On average, rich countries’ tax and transfer policies reduce inequality by about 36 percent. The figure in the United States: only about 24 percent.

In Sweden, market-based inequality shows a Gini of about 44, but the disposable income Gini sits at a much more equal 27, a reduction of 39 percent in inequality. In the United States, the market Gini comes in about 50. The disposable income Gini: just 38 in the OECD data, a reduction of only 24 percent.

Over the last generation, major changes in U.S. tax and transfer policies – mainly cuts in the tax rates on high incomes – have actually served to increase inequality.

Inequality, to be sure, is increasing in almost all high-income countries, the consequence of the triumph of global capitalism and its neoliberal policy package: market dominance, privatization, and deregulation. But even in this company, the United States stands out for the depth of its commitment to policies – particularly tax policies – that favor the rich.
The United States stands out for its policies that favor the rich.

Many Americans are, not surprisingly, concerned about excessive taxes. Ours, after all, has been a nation forged in a struggle against a grasping, remote, tax-hungry overlord. Yet when we compare ourselves to other countries about as rich and democratic as we are, it appears we are not highly taxed. Our total taxation level stands at about 24 percent of GDP (the total value of national production and income), a level significantly lower than the 34 percent average of the other high-ncome countries.

Why should we care about how little our tax system reduces inequality? Among the world’s high-income countries, the British epidemiologists Richard Wilkinson and Kate Pickett have powerfully pointed out in The Spirit Level, the more unequal societies – and regions within countries – have more violence, infant mortality, lower life expectancies, and more mental illness. Societies that are more equal, on the other hand, have more trust among people. Our levels of inequality produce fractured community and social resentment, and they drive sour and even violent politics.

Inequality has become like the weather: Everybody talks about it but no one does anything. Unlike the weather, we can fix this mess and heal these wounds. To do so, we may need a reminder from Supreme Court Justice Oliver Wendell Holmes, Jr.: “Taxes are what we pay for civilized society.”

Tuesday, December 24, 2013

Global Elites Getting Nervous About Skyrocketing Inequality...


...But Won't Spare a Nickel to Fix It

December 2013 | Alternet

Global elites are getting a bit antsy these days.

A new study by the World Economic Forum based on a survey of 1,592 leaders from academia, business, government, and the non-profit world suggests that all is not cheery at the top. It seems that elites believe that the second biggest problem facing Planet Earth in 2014 is widening income disparities (unrest in the Middle East and North Africa is their top worry). When it comes to economic issues, elites and ordinary folks are often at odds, but according to a recent Pew survey , they converge on identifying the gap between rich and poor as a major flaw in the system.

What’s clear is that the schemes elites have supported, from austerity policies to financial predation, are driving inequality to such extreme levels that everybody is now talking about it. The Pope is talking about it . Robert Reich made a movie about it. All over the world, people having been protesting and rioting in rolling demonstrations about it. An ugly resurgence of fascist elements in Europe is capitalizing on it. Even folks like Larry Summers, who promoted policies that stoke inequality, are publicly lamenting it.

The global elites are sittting on piles of obscene wealth, but they also have two big problems:
  1. Soft demand: When people are too poor to buy goods and services, businesses suffer and the whole economy lags.
  2. Prospects of increasing social unrest: When people are so squeezed that they think they have nothing to lose by taking to the streets, the wealthy have to hide behind barricades.

The global situation is crazy and probably unstable, and the 0.01 percent knows it. The question is, what are they prepared to do about it?

Not much — not yet, anyway. You can peruse the top mainstream newspapers to get a sense of how most elites feel about the growing gap between haves and have-nots. Lately there’s been quite a bit of handwringing and an uptick of articles on subjects directly related to inequality, but precious few signs that any substantial changes are on the horizon.

Case in point: Just after Thanksgiving, New York Times readers found a moving article  in the business section detailing the plight of unfortunate retail workers who don’t get paid enough to make ends meet. The author noted the hardship of food stamp cuts and described a situation so bad that companies had set up food drives for low-wage workers and dispensed tips on how to apply for public assistance (independent websites like AlterNet had been all over this story for weeks).

For a human touch, the NYT author quoted a depressed mom who works at Sears selling toys that she could never afford to buy for her own children. The author duly noted that Americans support raising the minimum wage by an overwhelming majority, but in typical mainstream media fashion, took a stance of faux neutrality and provided the opinions of two mainstream economists who disagreed on whether raising minimum wage was a good idea or not. Overall, the article seemed cautiously in favor of something that American voters overwhelmingly say they want.

Conclusion: Some elites might be willing to raise the minimum wage just a bit.

But a couple of weeks earlier, the Washington Post ran a widely reviled editorial on Social Security that showed the limits of elite concern. The vast majority of Americans, aware of an oncoming train wreck of a retirement crisis, are against cuts to Social Security, but the editorial board at the Post made it clear that elites are not on their side and laid out various specious arguments, including an irrational appeal to deficit hysteria (the deficit is actually decreasing ), to bolster its antisocial perspective. Elizabeth Warren, increasingly a thorn in the side of greedy elites, blasted the Post.

Conclusion: Elites are not really willing to pay taxes, and financiers wish to charge more fees on private retirement accounts, ergo Social Security must be cut. (Erskine Bowles and Alan Simpson, the co-chairs of Obama’s Deficit Commission, are the standard-bearers for this line, along with their backer, Wall Street billionaire Pete Peterson.)

You can also look to top establishment politicians for insight into just how much elites are willing to do to solve the inequality problem.

For instance, there’s the little matter of a giant loophole in the tax code that favors the rich. The “carried interest” loophole allows financiers like hedge fund managers, venture capitalists and partners in real estate investment trusts to pay a lower tax rate on their profits than working people pay on their earnings. It’s an unjust handout to the wealthy, and again, the American people are clear on how they feel about the tax code : the rich don’t pay their fair share.

The GOP is vehemently against closing the loophole. But despite the fact that Democrats raged against it last year to defeat Mitt Romney, it is Dems themselves who are standing in the way of getting anything done. As the Boston Globe noted in a recent article, Democrats are worried that “crusading against the ‘carried interest’ loophole at this stage would inflame an important source of campaign contributions for Democrats.”

Back when he was in the Senate, John Kerry did an elaborate dance around the issue, using his influential post on the Senate Finance Committee to seed skepticism and parrot industry warnings of dire “unintended consequences’’ and unnamed risks to the economy if the loophole were closed, even while voting in favor of the change. With Kerry now at the helm of the State Department, a host of other prominent Democrats, including President Obama and Senator Chuck Schumer, have been quietly working to see that nothing much will be done.

Conclusion: Filling campaign coffers is more important than dealing with grossly unfair policies that contribute to dangerous inequality.

So there you have it. Global elites know that they have a vital interest in solving the problem of inequality, but few are willing to pay a dime or accept substantive changes to our economic system in order to solve it.

Perhaps the megarich will simply take shelter in armed and gated communities and continue to thumb their noses at the 99 percent until a mass movement rises to stop them. But many have a vague recollection of what happened in the French Revolution. At a certain point, the barricades don’t hold.

Thursday, December 5, 2013

The Stock Market Bubble

Back to the Future on Wall Street
by MIKE WHITNEY


Wall Street is buzzing, and it’s all about bubbles.

In fact, according to Google Trends, interest in the term “stock bubble” was higher in November 2013 than anytime since October 2008.

And that should be expected given that the Dow Jones just broke through the 16,000-mark while the NASDAQ sailed-past the 4,000 milestone for the first time in 13 years. And did I mention that S&P 500 just closed above 1,800 for an all-time high?

While surging stocks are not proof of a bubble, they do draw attention to the condition of the underlying economy which is still in deep distress 5 years after the recession "ended." With "official" unemployment at 7.2% (and real unemployment twice that figure), GDP barley growing, droopy personal consumption, flagging durable goods, shrinking revenues, flatlining wages, falling incomes, widening inequality, plunging consumer sentiment, 47 million Americans on food stamps, and myriad other signs of persistent economic stagnation; the so called “recovery” is anything but robust. So where are stocks getting the oomph to keep rising?

That’s not a question that bothers the bubble deniers who have started popping up on the business channels like they did prior to the housing and the dot.com busts. These so called “experts” assure the public that all the bubble talk is just scaremongering by disgruntled Cassandras who don’t understand that current valuations are reasonable. They say that soaring prices reflect “strong fundamentals.

Uh huh.

Last week, serial bubblemaker, Alan Greenspan, made an appearance on Bloomberg TV where he scoffed at the idea of a stock bubble saying, “It’s a little on the upside, (But) “This does not have the characteristics, as far as I’m concerned, of a stock market bubble.”

There you have it from Maestro himself. No bubble here. Move along now.

Others, however, are not as confident as Greenspan. They think stock prices have less to do with fundamentals than they do with the Fed’s uber-accommodative policy which has kept short-term rates set below the rate of inflation for 5 years straight, providing a subsidy for risk taking. They also point to Fed chairman Ben Bernanke’s $85 billion per month asset purchase program, called QE, which has expanded the Fed’s balance sheet by $3 trillion lifting stock and bond prices across the board. Stock prices are based on Central Bank intervention. Fundamentals have nothing to do with it, nothing at all.

As for the bubble; judge for yourself:

Margin debt on the New York Stock Exchange is currently at its highest level ever. It’s even higher than before the crash in 2007. When investors borrow a lot of dough to buy stocks, you’re in a bubble, right? Because that’s what a bubble is, tons of credit pushing up prices. And when something bad happens, like the Lehman Brothers default, then all the over-extended borrowers have to dump their stocks pronto, which causes firesales, panics and financial meltdowns. Been there, done that.

So why is there so much margin debt now, you ask?

Because of zero rates. Because of QE. Because speculators think the Fed will keep prices high by pumping more liquidity into the system. It’s called the Bernanke Put, the belief that the Fed will prevent stocks from falling too fast, too far. Margin debt is a reasonable reaction to the Fed’s policy, which is why the Fed is ultimately responsible for the risky behavior.

Now check this out from the New York Times:
“Since the dark days of 2008, the Nasdaq has risen more than 150 percent, twice as much as the old-school Dow industrials. Money has been pouring into social media stocks. As of Friday, Twitter had risen nearly 60 percent since it went public only a few weeks earlier.

Once again, new “metrics” are being applied to justify stratospheric valuations. Twitter is losing money. A price-to-earnings ratio? There is no E in the P/E. But its stock is trading at 20-odd times the company’s annual sales. Good enough….

Eight months ago, Snapchat was valued at $70 million. Today, it is valued at $4 billion, even though it has zero revenue. Six months ago, Pinterest was valued at $2.5 billion. Today, it is valued at $3.8 billion — and no revenue there, either. And last week news broke that Dropbox was said to be seeking a new round of funding that would value the company at $8 billion, up from $4 billion a year ago.” (“Disruptions: If It Looks Like a Bubble and Floats Like a Bubble”, New York Times)

Did you catch that? A company with zero revenue is worth $3 billion more today than it was 8 months ago. So we’re back to the bad old days of the dot.com bust. This is the result of low rates and QE. It has nothing to do with fundamentals. We’re not talking earnings here. We’re talking manipulation, intervention, and central planning.
 
Then there’s this from the Wall Street Journal:
“Investment funds aimed at individual investors are barreling into collateralized loan obligations, a complex and volatile type of security that was shaken by the financial crisis.

Lured by annual returns of as high as 20%, some mutual-fund managers are buying CLOs through investment funds that purchase stakes in loans to companies with low credit ratings…. …

The biggest buyers of these securities usually are hedge funds, insurers and banks. But mutual funds and business-development companies, which pitch themselves to individual, or retail, investors, have collected more than $60 billion in money from clients this year, according to Keefe, Bruyette & Woods, Inc. and fund-data provider Lipper.

CLO returns are higher than on corporate bonds and other loans, but CLO prices could plunge if the risk rises that companies will run into trouble repaying their loans. That happened in 2011, and some fund managers say retail investors are mostly unaware that the firms they invest in are buying CLOs…” (“Volatile Loan Securities Are Luring Fund Managers Again”, Wall Street Journal)
So the big boys are climbing further out the risk curve to scratch out a higher rate of return on their investments; investments which–by the way– will eventually cost ”retail investors” (you and me) a bundle. 
 
And the reason these financial institutions are engaging in such risky behavior is because rates have been stuck at zero for 5 years, forcing them to look for higher yield wherever they can find it. It’s all part of the Fed’s Pavlovian conditioning. First you turn the interest rate dial to zero, then you juice stock’s prices with QE. And then you wait for the suckers (Mom and Pop) to reenter the market so you can cut them down like corn stalks in a combine. Works every time, just take a look:
“One development that has experts concerned is the return of individual investors, who are known for getting into the stock market near peaks…One way to measure their activity is to look at net inflows into stock mutual funds (excluding exchange-traded funds). When investors put more into stock funds than they take out, it’s called a net inflow. When they withdraw more than they invest, it’s a net outflow.

This year, net inflows totaled $176 billion through Nov. 20, according to Lipper…Most of that money is coming from bank accounts and money market funds…”

So the sheeple are about to get sheared again, right? Just like Bernanke and his Wall Street buddies planned from the get go. But, guess what? Just as Mom and Pop are getting back into stocks again, the big boys are getting out. Take a look at this report from BofAML from the Macronomics blogsite:

”BofAML clients were net sellers of US stocks for the fifth consecutive week, in the amount of $2.3bn. Net sales were led by institutional clients, who returned to net selling following a week of muted buying.

Institutional clients remain the biggest net sellers year-to-date, with cumulative net sales of over $23bn—larger than in either 2008 or 2010. …..Hedge funds were also net sellers for the second consecutive week, while private clients returned to net buying after a week of selling. This group has been a net buyer for 23 of the past 26 weeks.” (“Credit: All that glitters, ain’t gold”, Macronomics)

How do you like that? So once the chickens get lured back into the henhouse, the door slams shut and the fox fires up the stove for another big feed. Isn’t this how it always works out?

Now check this out in Forbes about ”cov lite” loans:

“Covenant-lite loan activity in 2013 is smashing all records, and appears to be picking up speed. Through Aug. 8 there has been $162 billion of covenant-lite loan issuance in the U.S., more than five times the amount seen at this point in 2012, and easily topping the $86 billion of cov-lite deals logged all of last year.” (“Cov lites” soar to new record”, Forbes)

Unfortunately, cov lites are a particularly lethal form of lending which strips “typical lender protections” from credit agreements. Here’s the scoop from the New York Times:

“Leveraged loans became popular before the 2008 collapse but nearly disappeared afterward, regarded as a symbol of unbridled lending. But they started to return in 2010 and are now back in force, with volumes of $548.4 billion this year through Nov. 14, already exceeding the precrisis level of $535.2 billion in 2007.

The type of leveraged loans that Learfield took out are known as covenant-lite, financial lingo for loans that lack the tripwires that could alert investors to any potential financial troubles at the company that could affect repayment. More than half of all leveraged loans issued this year have been the so-called cov-lite types, double the level seen in 2007 on the eve of the credit crash.” (“New Boom in Subprime Loans, for Smaller Businesses”, New York Times)

So, let’s recap: The Fed has managed to spark another surge in risky lending (that “exceeds precrisis levels”) that threatens to blow up in investors faces leaving them less prepared for retirement than they are today.

Check.

And there’s more. Take a look at the recent stock buyback frenzy, which is where companies buy their own stock to goose the price instead of investing in plants, equipment, hiring, or any other type of useful, productive activity. This is from Bloomberg:
“Multiple expansion through share buybacks have been driving indeed the stock market higher greater than earnings have. …. Buybacks rose by 18% Quarter-over-quarter to $118 billion in 2013, up 11% year-over-year to $218 billion.”  (Bloomberg)

Even so, Greenspan sees no bubble. Stock prices are based on good old fundamentals, like earnings. What could be more fundamental than earnings, right?

Take a look at this from the Testosterone Pit:
“Corporate earnings will grow this year at their lowest level since 2009. Revenue growth at public companies is almost non-existent. Companies are buying back stock at a record pace to boost per-share earnings.”  (“What Really Bothers Me About this Stock Market”,  Michael Lombardi, Testosterone Pit)
Huh? So earnings aren’t so hot either?

Apparently not. And that means the fundamentals are actually weak, which makes sense since the economy is in the crapper.

Then we ARE in a bubble, after all?

Yep. And when it bursts it’s going to cost a lot of people a lot of money.  Just like last time.

Tuesday, October 22, 2013

The Triumph of the Right


Conservative Republicans have lost their fight over the shutdown and debt ceiling, and they probably won’t get major spending cuts in upcoming negotiations over the budget.

But they’re winning the big one: How the nation understands our biggest domestic problem.

They say the biggest problem is the size of government and the budget deficit.

In fact our biggest problem is the decline of the middle class and increasing ranks of the poor, while almost all the economic gains go to the top.

The Labor Department reported Tuesday that only 148,000 jobs were created in September — way down from the average of 207,000 new jobs a month in the first quarter of the year.

Many Americans have stopped looking for work. The official unemployment rate of 7.2 percent reflects only those who are still looking. If the same percentage of Americans were in the workforce today as when Barack Obama took office, today’s unemployment rate would be 10.8 percent.

Meanwhile, 95 percent of the economic gains since the recovery began in 2009 have gone to the top 1 percent. The real median household income continues to drop, and the number of Americans in poverty continues to rise.
So what’s Washington doing about this? Nothing. Instead, it’s back to debating how to cut the federal budget deficit.

The deficit shouldn’t even be an issue because it’s now almost down to the same share of the economy as it’s averaged over the last thirty years.

The triumph of right-wing Republicanism extends further. Failure to reach a budget agreement will restart the so-called “sequester” — automatic, across-the-board spending cuts that were passed in 2011 as a result of Congress’s last failure to agree on a budget.
These automatic cuts get tighter and tighter, year by year — squeezing almost everything the federal government does except for Social Security and Medicare. While about half the cuts come out of the defense budget, much of the rest come out of programs designed to help Americans in need: extended unemployment benefits; supplemental nutrition for women, infants and children; educational funding for schools in poor communities; Head Start; special education for students with learning disabilities; child-care subsidies for working families; heating assistance for poor families. The list goes on.

The biggest debate in Washington over the next few months will be whether to whack the federal budget deficit by cutting future entitlement spending and closing some tax loopholes, or go back to the sequester. Some choice.

The real triumph of the right has come in shaping the national conversation around the size of government and the budget deficit – thereby diverting attention from what’s really going on: the increasing concentration of the nation’s income and wealth at the very top, while most Americans fall further and further behind.

Continuing cuts in the budget deficit – through the sequester or a deficit agreement — will only worsen this by reducing total demand for goods and services and by eliminating programs that hard-pressed Americans depend on.

The President and Democrats should re-frame the national conversation around widening inequality. They could start by demanding an increase in the minimum wage and a larger Earned Income Tax Credit. (The President doesn’t’ even have to wait for Congress to act. He can raise the minimum wage for government contractors through an executive order.)

Framing the central issue around jobs and inequality would make clear why it’s necessary to raise taxes on the wealthy and close tax loopholes (such as “carried interest,” which enables hedge-fund and private-equity managers to treat their taxable income as capital gains).

It would explain why we need to invest more in education – including early-childhood as well as affordable higher education.

This framework would even make the Affordable Care Act more understandable – as a means for helping working families whose jobs are paying less or disappearing altogether, and therefore in constant danger of losing health insurance.

The central issue of our time is the reality of widening inequality of income and wealth. Everything else — the government shutdown, the fight over the debt ceiling, the continuing negotiations over the budget deficit — is a dangerous distraction. The Right’s success in generating this distraction is its greatest, and most insidious, triumph.

Sunday, May 5, 2013

Hypocrites With Fat Wallets: CEOs Want It All

Sunday, 05 May 2013 | By Sam Pizzigati, Inequality.org

America’s top corporate executives love lecturing the rest of us about ‘fiscal responsibility.’ They want us to expect less from government. But they expect more, and a new report shows how they’re getting it.

Last week, federal unemployment benefits for the 400,000 Californians out of work since last fall dropped almost 18 percent, a $52 cut out of an average $297 weekly check. Similar cuts have already started rolling out in other states.

In all, 3.8 million long-term unemployed Americans will on average lose near $1,000 each by September 30, the date that ends the 2012 federal fiscal year.

The direct cause of all these cuts: the “sequester,” the $85 billion in federal austerity budget reductions that kicked in this past March 1.

Who deserves the “credit” for this meat-axe sequester? Credit the power suits who occupy Corporate America’s loftiest executive suites. These top corporate executives — organized in groups like “Fix the Debt” and the Business Roundtable — have been lobbying relentlessly for deep cuts in federal spending.

Only significant cutbacks in programs near and dear to average Americans, these executives proclaim, can save the nation from debt disaster.

But these same top executives, says a new report released last week, are actually running up the federal debt — purely to enrich themselves.

The giant firms these execs manage, details this new report from the Institute for Policy Studies and the Campaign for America’s Future, “are exploiting the U.S. tax code to send taxpayers the bill for the huge rewards they’re doling out to their top executives.”

How huge do these rewards go? UnitedHealth Group CEO Stephen Hemsley, a “Fix the Debt” endorser, pulled in $199 million between 2009 and 2011.

A convenient federal tax loophole — in place since 1993 — let UnitedHealth deduct $194 million of that windfall compensation on its corporate tax return. That deduction, in turn, saved UnitedHealth — and denied the federal treasury — $68 million, enough to extend full federal unemployment benefits for the rest of the 2013 fiscal year to over 65,000 jobless Americans.

The loophole UnitedHealth so lucratively exploited lets companies deduct off their taxes every dollar of “performance pay” they shovel into their executives’ personal pockets. UnitedHealth, of course, hardly stands alone here. All American corporate and banking giants play the “performance pay” game.

The 90 giant firms that belong to “Fix the Debt” play the game particularly well. Between 2009 and 2011, the deductions these 90 claimed for top executive “performance pay” added at least $953 million — and maybe as much as $1.6 billion — to America’s national debt.

The U.S. tax code’s exceedingly bountiful “performance pay” loophole has its roots in an earlier epoch of American public outrage at excessive CEO pay. Back in 1992, Bill Clinton campaigned against over-the-top executive pay in his drive for the White House. Congress, just months after Clinton’s inauguration, would go on to pass legislation that lawmakers hailed as a check on CEO excess.

The new law allowed corporations to deduct off their taxes no more than $1 million in compensation per executive. But the law had a huge escape hatch. Firms could exempt any “performance-based” pay from the $1 million limit.

The predictable result? An explosion of “performance-based” compensation, particularly in the form of stock options, an explosion that would keep CEO pay soaring. CEOs had been averaging 42 times U.S. worker pay in 1982. By 1992, the gap had jumped to 201 times. The average gap today: 354 times.

The “performance pay” loophole, the new Institute for Policy Studies and the Campaign for America’s Future report stresses, has served “as a critical subsidy for excessive compensation.”

“The larger the executive payout, the less the corporation pays in taxes,” the report explains. “And average taxpayers wind up footing the bill.”

That footing would end if legislation Representative Barbara Lee from California has introduced ever became law. Her Income Equity Act would deny corporations a tax deduction on any executive compensation that runs over 25 times the pay of a company’s lowest-paid workers or $500,000.

Interestingly, the Affordable Health Care Act enacted in President Obama’s first term sets a $500,000 cap, effective this year, on how much health insurers like UnitedHealth can deduct for executive compensation.

With this cap now law for health care execs, notes the new Institute for Policy Studies and the Campaign for America’s Future report, “taxpayers won’t have to worry so much about their hard-earned dollars going to subsidize fat paychecks for CEOs like Stephen Hemsley of UnitedHealth.”

“But,” sums up the study, “taxpayers may want to wonder why — at a time of scarce government resources — their tax dollars are subsidizing fat paychecks at any American corporate giant.”

Saturday, May 4, 2013

Average Income For The Bottom 90 Percent Of Americans Grew Just $59 In 40 Years

By Travis Waldron | ThinkProgress

The top 10 percent of Americans have experienced rapid income growth over the last 40 years, but the bottom 90 percent haven’t been so lucky. In fact, average income rose just $59 from 1966 to 2011 for the bottom 90 percent once those incomes were adjusted for inflation.

That’s according to a new study of tax data from David Cay Johnston, who won a Pulitzer Prize for his writing about tax policy. While the bottom 90 percent’s incomes rose just $59, the top 10 percent fared much better, he found:
In 2011 the average AGI of the vast majority fell to $30,437 per taxpayer, its lowest level since 1966 when measured in 2011 dollars. The vast majority averaged a mere $59 more in 2011 than in 1966. For the top 10 percent, by the same measures, average income rose by $116,071 to $254,864, an increase of 84 percent over 1966.

The difference in those gains has reduced the share of income the bottom 90 percent holds as well. That segment held two-thirds of all household income in 1966 but just 51.8 percent in 2011, Cay Johnston found. Other studies have had similar results. One study found that pay for chief executives increased 127 times faster than worker pay over the last 30 years, and official data has shown worker wages stagnating since the 1970s. That has led to a sharp increase in American income inequality, which now rivals rates from countries like the Ivory Coast and Pakistan.

The biggest driver in that disparity, Cay Johnston wrote, was not that the rich were working harder, “but the shift of income from labor to capital and changes in federal income, gift, and estate tax rules.” Indeed, the estate tax has been eased over recent decades and federal income taxes have become more favorable to the wealthy thanks to breaks for investment income. A recent study, in fact, found that the capital gains tax cut, which benefits the wealthy but does virtually nothing for everyone else, was “by far” the biggest driver in the growth of American income inequality. (HT: Huffington Post)

Wednesday, May 1, 2013

Tracking CEO Compensation

The Best Indicator of Inequality is the Gap Between What CEOs and Their Workers are Paid
by SAM PIZZIGATI


Under current U.S. law, all our publicly traded corporations must annually disclose exactly what they pay their top executives. So why do all those CEO pay scorecards we see every spring show such different results?

USA Today found an 8 percent hike in 2012 CEO pay while The New York Times detected an 18.7 percent increase. Towers Watson, a corporate consulting firm, announced that CEO pay growth “slowed considerably,” rising at just a 1.2 percent rate last year.

What explains all these wildly divergent results? Let’s start with how corporations pay their top execs. This can get tricky.

Most executive pay today comes as stock-related compensation. Stock “options” give executives the right, down the road, to buy shares of their company stock at today’s share price. If that share price jumps, the execs can buy low and sell high. Instant windfall.

“Restricted” stock awards, on the other hand, give executives actual shares of stock, not just an option to buy them. Execs do have to wait a few years before they can actually claim these shares. No big deal. The shares will still have value in future years even if a company’s stock takes a hit.

But how should we value all this share-related compensation right now? Should CEO pay scorekeepers estimate how much stock awards granted this year will be worth in years to come? Or should scorekeepers only tally stock-related awards when execs actually profit personally from them?

Different executive pay scorekeepers give different answers. Scorekeepers also keep score on different sets of corporations. USA Today‘s new scorecard for 2012 tallies pay at 170 firms, the New York Times at just 100.

Given all this, do we have any single stat that tells us what we need to know? We do. That stat: the divide between worker and top executive pay.

America’s big-time CEOs, labor researchers at the AFL-CIO report, are now making 354 times the pay of average U.S. workers, the “largest pay gap in the world.”

Three decades ago, in 1982, American CEOs averaged just 42 times more than average U.S. workers. Two decades ago, in 1992, the gap stood at 201 times. A decade ago: 281 times.

The overall trend line, in other words, couldn’t be clearer. How can we reverse it? Identifying the specific pay gap between individual CEOs and their own workers would be a good first step.

Corporations have had to publish, for decades now, how much they pay their top execs. They haven’t had to reveal publicly how much — or how little — they pay their workers. The Dodd-Frank Wall Street Reform and Consumer Protection Act enacted in 2010 changes this dynamic, at least on paper.

Dodd-Frank requires corporations to annually disclose the gap between what they pay their CEOs and their most typical workers. But a corporate lobbying blitz has kept the Securities and Exchange Commission from writing the regulations needed to enforce this disclosure mandate.

Why do our biggest corporations so fervently oppose disclosing their CEO-worker pay ratios? Disclosure by itself, after all, won’t shove down CEO pay levels. But disclosure could open the door to other steps that could curb CEO pay excess.

Lawmakers could, for instance, choose to deny government contracts or tax breaks to corporations that pay their top executives over 25 or even 50 times what their own workers are making.

Far-fetched? Current law already denies government contracts to companies that discriminate by race or gender in their employment practices. As a society, we’ve concluded that our tax dollars must not go to corporations that widen racial or gender inequality.

So why should we let our tax dollars enrich corporations that widen our economic divide?

Sunday, April 28, 2013

Recovery for the 7 Percent

April 28, 2013 — Paul Craig Roberts

“From the end of the recession in 2009 through 2011 (the last year for which Census Bureau wealth data are available), the 8 million households in the U.S. with a net worth above $836,033 saw their aggregate wealth rise by an estimated $5.6 trillion, while the 111 million households with a net worth at or below that level saw their aggregate wealth decline by an estimated $600 billion.” ~ Pew Research, An Uneven Recovery, by Richard Fry and Paul Taylor.

Since the recession was officially declared to be over in June 2009, I have assured readers that there has been no recovery. Gerald Celente, John Williams (shadowstats.com), and no doubt others have also made it clear that the alleged recovery is an artifact of an understated inflation rate that produces an image of real economic growth.

Now comes the Pew Research Center with its conclusion that the recession ended only for the top 7 percent of households that have substantial holdings of stocks and bonds. The other 93% of the American population is still in recession.

The Pew report attributes the recovery for the affluent to the rise in the stock and bond markets, but does not say what caused these markets to rise.

The stock market’s recovery does not reflect rising consumer purchasing power and retail sales. The labor force is shrinking, not growing. Job growth lags population growth, and the few jobs that are created are primarily dead-end jobs in lowly paid domestic services. Retail sales adjusted for inflation and real median household income have been bottom bouncing since 2009.

To the extent that there is profit growth in US corporations, it comes from labor cost savings from offshoring US jobs and from bringing in foreign workers on work visas. By lowering labor costs, corporations boost profits and thereby capital gains for those 7 percent who have large holdings of financial assets. Those in the 93 percent who are displaced by foreign workers experience income reductions. This transfer of the incomes of the 93 percent to the 7 percent via jobs offshoring and work visas is the reason for the stark rise in US income inequality.
Another source of the stock market’s rise is the Federal Reserve’s policy of quantitative easing, that is, the printing of $1,000 billion dollars annually with which to support the too-big-to-fail banks’ balance sheets and to finance the federal budget deficit. The cash that the Fed is pouring into the banks is not finding its way into business and consumer loans, but the money is available for the banks to speculate in derivatives and stock market futures. Thus, the Fed’s policy, which is directed at keeping afloat a few oversized banks, also benefits the 7 percent by driving up the value of their stock portfolios.

The reason bond prices are so high that real interest rates are negative is that the Fed is purchasing $1,000 billion of mortgage-backed “securities” and US Treasury debt annually. The lower the Fed forces interest rates, the higher go bond prices. If you are among the 7 percent, the Fed has produced capital gains for your bond portfolio. But if you are a saver among the 93 percent, you are losing purchasing power because the interest you receive is less than the rate of inflation.

The Pew report puts it this way: Since the “recovery” that began in June 2009, wealthy households experienced a 28 percent rise in their net worth, while everyone else lost 4 percent of their assets.

Is this the profile of a democracy in which government serves the public interest, or is it the profile of a financial aristocracy that uses government to grind the population under foot?

Friday, December 7, 2012

The Obscenely Rich Men Bent on Shredding the Safety Net

They want to cut social security and medicare to line their own pockets, not to address the budget deficit/national debt.--jef

##########
By Lynn Stuart Parramore | AlterNet
New York magazine calls it a “Mass Movement for Millionaires.” The New York Times' Paul Krugman sums up the idea: “Hey, sacrifice is for the little people.”

The Campaign to Fix the Debt is a huge, and growing, coalition of powerful CEOs, politicians and policy makers on a mission to lower taxes for the rich and to cut Social Security, Medicare and Medicaid under the cover of concern about the national debt. The group was spawned in July 2012 by Erskine Bowles and Alan Simpson, architects of a misguided deficit reduction scheme in Washington back in 2010. By now, the "fixers" have collected a war chest of $43 million. Private equity billionaire Peter G. Peterson, longtime enemy of the social safety net, is a major supporter.

This new Wall Street movement, which includes Republicans and plenty of Democrats, is hitting the airwaves, hosting roundtables, gathering at lavish fundraising fêtes, hiring public relations experts, and traveling around the country to push its agenda. The group aims to seize the moment of the so-called "fiscal cliff" debate to pressure President Obama to concede to House Republicans and continue the Bush income tax cuts for the rich while shredding the social safety net. The group includes Goldman Sachs’ Lloyd Blankfein, JPMorgan Chase’s Jamie Dimon, Honeywell’s David Cote, Aetna’s Mark Bertolini, Delta Airlines’ Richard Anderson, Boeing’s W. James McNerney, and over 100 other influential business honchos and their supporters.

Corporations represented by the fixers have collected massive bailouts from taxpayers and gigantic subsidies from the government, and they enjoy tax loopholes that in many cases bring their tax bills down to zero. Sometimes their creative accountants even manage to get money back from Uncle Sam. For instance, according to Citizens for Tax Justice, Boeing has paid a negative 6.5 percent tax rate for the last decade, even though it was profitable every year from 2002 through 2011.

These CEOs talk about shared sacrifice, but it seems that they don’t intend to share anything but your retirement money with their wealthy friends. As New York mag reports:
“Most on-the-record comments are a mishmash of platitudes about shared sacrifice and working together for the good of the country. But interviews with a number of organizers and CEO council members point to a massive networking effort among one-percenters — one that relies on strategically exploiting existing business relationships and appealing to patriotic and economic instincts."
As the Fix the Debt gang moves around the country spreading their message, they are starting to attract public protests. On November 27, they were greeted in North Carolina with a rally  from NC Progress, which called for an end to the Bush tax cuts for the wealthiest 2 percent and told the group to keep its hands off the middle-class wallet. The fixers are often vague about their mission, and they tend to speak in coded language that conceals their actual goals. Let’s have some blunt talk about what the fixers want to do and why they want to do it – talk you're unlikely to hear in mainstream media supported by corporate advertising.

1. “Fix” means cut: When they say “fix” Social Security, they mean cut Social Security. Fixers want to convince the public that a well-managed, hugely popular program that does not add to the deficit (it’s self-funded) is somehow in crisis and requires intervention in the form of various cutting schemes. They seek this because many of the rich do not want to pay taxes for Social Security, and financiers want very much to move toward privatization of retirement accounts so they can collect fees on such accounts.

2. “Reform” means rob. When the say “reform” the tax code, they mean “make taxes even lower for the rich.” The wealthy do not pay their fair share of taxes in the United States, which is a major reason there is a large deficit in the first place. When the very wealthy pay lower tax rates than ordinary working people, the result is an increasing redistribution of income upward that puts the U.S. in the top 30 percent in income inequality out of 140 nations, according to the Central Intelligence Agency [7]. We’re a shameful #42. Income inequality is not only unfair, it’s dangerous and makes society unstable.

3.“Bipartisan” means all of the rich. Fix the Debt is a pro-business ideological movement pretending to be a bipartisan group of concerned citizens. But the group is really just a coalition for the greedy, unpatriotic rich. There are plenty of financiers and other 1 percenters in the Democratic Party, and some of them have decided to join forces with their GOP counterparts to work toward a goal that means a great deal to all of them: Making the rich even richer.

4. “Concern” means covet. There was a time, a couple of generations ago, when business leaders would not dare to go public with their desire to increase income inequality and stick it to hard-working Americans. When Owen D. Young, CEO of General Electric in the '20s and '40s, spoke to an audience at Harvard Business School in 1927, he emphasized that the purpose of a corporation was to provide a good life not only to owners, but also to employees. Corporations, he said, were meant to serve the larger goals of the nation:
“Here in America, we have raised the standard of political equality. Shall we be able to add to that, full equality of economic opportunity? No man is wholly free unless he is both politically and economically free.”
Fast forward to 2012: Jeffrey Immelt, the current CEO of GE, is a member of the Fix the Debt Campaign, which is designed to lower the expectations of hard-working Americans. Goldman Sachs honcho Lloyd Blankfein explained this recently in a CBS interview:
 “You’re going to have to do something, undoubtedly, to lower people’s expectations of what they’re going to get, the entitlements, and what people think they’re going to get, because you’re not going to get it.” ~ Goldman Sachs CEOLloyd Blankfein

5. “Fiscal conservative” means economically confused. Longtime Wall Street executive Steve Rattner, one of Obama’s auto bailout czars, has been using his influence to attract tycoons from the financial industry to the Fix the Debt movement. Over the last year, Rattner has been on a crusade to convince Americans that they should put aside their worries about real crises like unemployment to focus on the deficit. Rattner, like many of his cohorts, poses as a moderate whose thinking is needed to counter the advice of respected economists like Nobel Prize-winners Paul Krugman and Joseph Stiglitz, who have long been warning that defict hysteria is not only counterproductive, but based on a lack of understanding of how the economy actually works.

Political economist Thomas Ferguson, who teaches at UMass Boston and is a senior fellow at the Roosevelt Institute, described the dubious policies the fixers defend:
“Talk about the audacity of hope! The people who brought you the Great Recession by pushing deregulation and financial leverage to insane dimensions are back. Now they propose to ‘fix the debt’ by throwing average Americans who generously bailed them out in 2008-09 over the fiscal cliff.
One trusts that even in our money-driven political system, their transparently self-interested nonsense will be firmly rejected. There is no reason why anyone needs to do anything at all about Social Security for a long time; as even Peter Orszag admits in the fine print. It just isn't a driver of the deficit.
The U.S. does need to reduce its spending on defense and it certainly needs to aggressively contain medical costs. But you do both of those the old fashioned way. In the case of defense, you stop plunging into wars and attend carefully to what actually is needed to defend America. In the case of medical spending, you end ‘fee for service’ schemes that reward endless tests and procedures and you vigorously pursue anti-trust and regulatory remedies. You don't simply cut Americans off from health care. It's ridiculous that we have ‘single payer’ for ailing banks, but not citizens. If you are worried about the deficit, just let tax rates rise back to the levels of the Clinton era, when growth ran far ahead of today's economy, and tax dividends, carried interest, and capital gains at the rates working Americans pay. And don't, absolutely don't, let American companies escape taxation by stashing their money abroad.”
6. "Strip-mining is not leadership." Fixers present themselves as magnanimous, responsible leaders doing what they believe is best for the country. But that’s a tough sell when you’re advocating policies that mainly benefit…yourself.

Economist Rob Johnson, director of the Institute for New Economic Thinking and also a senior fellow at the Roosevelt Institute, shared his view of the Campaign to Fix the Debt in an email. As he memorably put it, "strip-mining is not leadership":
“I believe that a convincing argument depends upon the demonstrated self-sacrifice of the leader offering a vision. This group does not appear to be doing something for the nation. They are doing something for their own self-interest (tax liability). There is confusion between: 1) what is good for business and therefore jobs, something we all should be concerned about; and 2) the personal benefit of CEOs based on who bears the burden of the debt reduction plan. This group does not seem to gain the credibility that comes from generous contribution through self sacrifice. As a result they will arouse great suspicion rather than inspire us as 'leaders' who are guiding the design of a just, productive and coherent society.  
With all of the suspicion of leadership in America,  business, media, scholars and politicians have to lead in a credible way. This just looks like guys defending their self-interest in a dysfunctional period of our nation's history because elites take so much for themselves.”

It's no secret that the wealthy have done extremely well over the last several decades, even since the Wall Street-driven financial crash that devastated millions of Americans. In 2010, the top 1 percent of U.S. families raked in as much as 93 percent of the country’s income growth, according to Emmanuel Saez, a UC Berkeley economist who looked at IRS data.

Which raises several important questions for Bowles, Simpson, Blankfein, Rattner & Co.: How much is enough? How far are you willing to tip the balance of income in the country toward the wealthy? What concern do you really have about the deficit, or for that matter, the future of America? Inquiring minds want to know. 

America's Staggering Wealth Divide

Inequality in America is even worse than it seems, with personal debt papering over the true state of affairs.
December 3, 2012  |  AlterNet  |  By Paul Bucheit
 
Most people associate inequality with the income gap. As distorted as the distribution of income may be, our wealth distribution is even more extreme. Americans are beginning to realize that years of preferential tax treatment for the rich, under the guise of "supply-side job creation" nonsense, have bloated the fortunes of the super-rich to a level that would make Rockefeller and Carnegie envious.

1. We're close to being the most unequal country in the world.

Among countries with at least a quarter-million adults, only Russia, Ukraine, and Lebanon are more unequal, according to the most recent figures ] from Credit Suisse Research .

An earlier report  by the same research team had indicated that Denmark and Switzerland were more unequal than the United States. While Switzerland is still high in the new data listing, ranking 18th, Denmark is actually rather equal relative to other countries, and received its dubious earlier position due to its own accurate reporting of household debt, as will be noted in Fact 5 below.

2. Wealth accumulation has been rigged for the rich.

The richest quintile of Americans owns 93% of non-home wealth. For Americans with incomes over $10 million, nearly half of their income comes from capital gains and dividends, on most of which they pay only a 15% tax. From 2002 to 2007, two-thirds  of all income went to the richest 1%. Then, in the first year after the recession, a startling 93% of all new income went to the richest 1%.

Massive wealth holdings have accumulated for the richest Americans not only because of their appropriation of income, but also because of their manipulation of the tax code. The 15% capital gains tax is their proudest accomplishment. Other ploys include carried interestperformance-related paystock options, and deferred compensation.

The imaginary 'work' of financial gain gets taxed at a much lower rate than real work. Through the years, as the rich have fattened up on stocks and other financial assets, the stock market has grown three times faster than the GDP. Yet American workers have not benefited from their own productivity. Their wages have flatlined  while the fruits of their labor have gone to investors.

3. As tax rates have gone down, income for the rich has gone up.

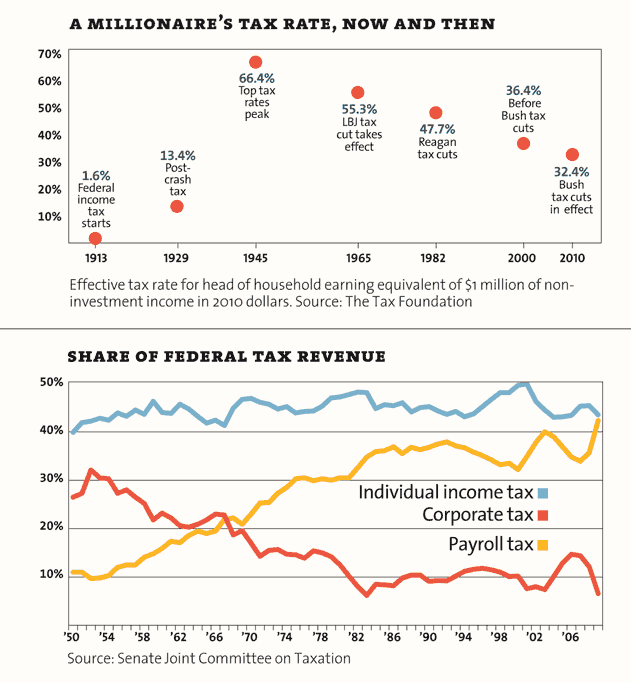
A Business Insider chart depicts the remarkable - yet reasonable - negative correlation between tax rates and the wealth of the super-rich. Over the past hundred years, every time tax rates have been decreased, the income percentage of the richest .01% has increased, and vice versa. Other  sources  confirm that changes in the tax rate have little to do with economic growth, and that the top tax rate can - and should - be much higher, up to 83%.

The Reagan-era myth of "higher taxes, less revenue" has been debunked. It's enough to convince any thinking American outside of Congress that our budget problems are rooted in an extraordinary degree of tax avoidance at the top.

4. "We should all cheer for the stock market" is a big scam.

The mainstream media would have us believe that the whole country depends on a rising stock market. But the lowest-earning three-fifths of Americans -- 60% of the population -- own just .2%  (one-fifth of one percent) of all wealth outside the home.

The Heritage Foundation and the American Enterprise Institute claim that wealth inequality has remained steady over the past century, even in the last 30 years. Both organizations cite a paper by Kopczuk and Saez , which shows that the share of wealth owned by the top 1% has decreased from the early 1900s to the early 2000s, possibly because the "democratization of stock ownership...now spreads stock market gains and losses much more widely than in the past."

While it's true that the percentages of net worth and financial wealth for the top 1% barely budged from 1983 to 2007, the percentages for the rest of the richest 5% increased by almost 20%. And the percentages for the poorest 80% of the population DECREASED by almost 20%.

In other words, the share of wealth owned by the top 1% leveled off because the "democratization of stock ownership" spread the wealth among just 5% of the population, those earning an average of $500,000 per year. A few people -- 5 out of 100 -- got very rich, but everyone else lost ground.

5. Debt has masked wealth inequality for 30 years

The authors of the Global Wealth Report  state: "Rising household debt...began around 1975. Before this date, the ratio of household debt to annual disposable income within countries remained fairly stable over time and rarely rose above 75%." Today, Americans are burdened with over $11 trillion  in consumer debt, including mortgages, student loans, and credit card liabilities. As the very rich have accumulated income and wealth, the middle class has kept up appearances by taking out loans.

However, that's only half the story. Private debt appears to be more manageable when public debt is low. Denmark has the highest household debt to wealth ratio in the world, but its government debt amounts to just 3% of the financial wealth of Danish households. The U.S. is at 32%. And our government debt as a percentage of GDP is 103%, one of the highest percentages in the world.

Conclusion: Where is all the wealth coming from?

According to the authors of the Global Wealth Report , the world's wealth has doubled in ten years, from $113 trillion to $223 trillion, and is expected to reach $330 trillion by 2017.

The UN definition of wealth  includes (1) natural capital: land, forests, fossil fuels, and minerals; (2) physical capital: buildings and infrastructure; and (3) human capital: the population's education and skills.

We need to add a 4th category: the magical creation of wealth by the financial industry.

Thursday, November 1, 2012

The Inequality Gap

Silly Tales Economists Like to Tell
by DEAN BAKER

There is no serious dispute that the United States has seen a massive increase in inequality over the last three decades. However there is a major dispute over the causes of this rise in inequality.

The explanation most popular in elite and policy circles is that the rise in inequality was simply the natural working of the economy. Their story is that the explosion of information technology and globalization have increased demand for highly-skilled workers while sharply reducing the demand for less-educated workers.

While the first part of this story is at best questionable, the second part should invite ridicule and derision. It doesn’t pass the laugh test.

As far as the technology story, yes information technologies have displaced large amounts of less-skilled labor. So did the technologies that preceded them. There are hundreds of books and articles from the 1950s and 1960s that expressed grave concerns that automation would leave much of the workforce unemployed. Is there evidence that the displacement is taking place more rapidly today than in that era? If so, it is not showing up on our productivity data.

More germane to the issue at hand, unlike the earlier wave of technology, computerization offers the potential for displacing vast amounts of highly skilled labor. Legal research that might have previously required a highly skilled lawyer can now be done by an intelligent college grad and a good search engine. Medical diagnosis and the interpretation of test results that may have previously required a physician, and quite possibly a highly paid specialist, can now be done by technical specialists who may not even have a college education.

There is no reason to believe that current technologies are replacing comparatively more less-educated workers than highly educated workers. The fact that lawyers and doctors largely control how their professions are practiced almost certainly has much more to do with the demand for their services.

If the technology explanation for inequality is weak, the globalization part of the story is positively pernicious. The basic story is that globalization has integrated a huge labor force of billions of workers in developing countries into the world economy. These workers are able to fill many of the jobs that used to provide middle-class living standards to workers in the United States and will accept a fraction of the wage. This makes many formerly middle-class jobs uncompetitive in the world economy given current wages and currency values.

This part of the story is true. The part that our elite leave out is that there are tens of millions of bright and highly educated workers in the developing world who could fill most of the top-paying jobs in the U.S. economy: doctors, lawyers, accountants, etc. These workers are also willing to work for a small fraction of the wages of their U.S. counterparts since they come from poor countries with much lower standards of living.

The reason why the manufacturing workers, construction workers, and restaurant workers lose their jobs to low-paid workers from the developing world, and doctors and lawyers don’t, is that doctors and lawyers use their political power to limit the extent to which they are exposed to competition from their low-paid counterparts in the developing world.  
Our trade policy has been explicitly designed to remove barriers that prevent General Electric and other companies from moving their manufacturing operations to Mexico, China or other developing countries. By contrast, many of the barriers that make it difficult for foreign professionals to work in the United States have actually been strengthened in the last two decades.
If economics was an honest profession, economists would focus their efforts on documenting the waste associated with protectionist barriers for professionals. They devoted endless research studies to estimating the cost to consumers of tariffs on products like shoes and tires. It speaks to the incredible corruption of the economics profession that there are not hundreds of studies showing the loss to consumers from the barriers to trade in physicians’ services. If trade could bring down the wages of physicians in the United States just to European levels, it would save consumers close to $100 billion a year.

But economists are not rewarded for studying the economy. That is why almost everyone in the profession missed the $8 trillion housing bubble, the collapse of which stands to cost the country more than $7 trillion in lost output according to the Congressional Budget Office. (That comes to around $60,000 per household.)

Few if any economists lost their six-figure paychecks for this disastrous mistake. But most economists are not paid for knowing about the economy. They are paid for telling stories that justify giving more money to rich people. Hence we can look forward to many more people telling us that all the money going to the rich was just the natural workings of the economy. When it comes to all the government rules and regulations that shifted income upward, they just don’t know what you’re talking about.