Latest statistics show stagnant wages, persistent long-term joblessness, soaring profits and stock prices, and moderating health care spending.
January 15, 2014 / FACTCHECK.org
Summary
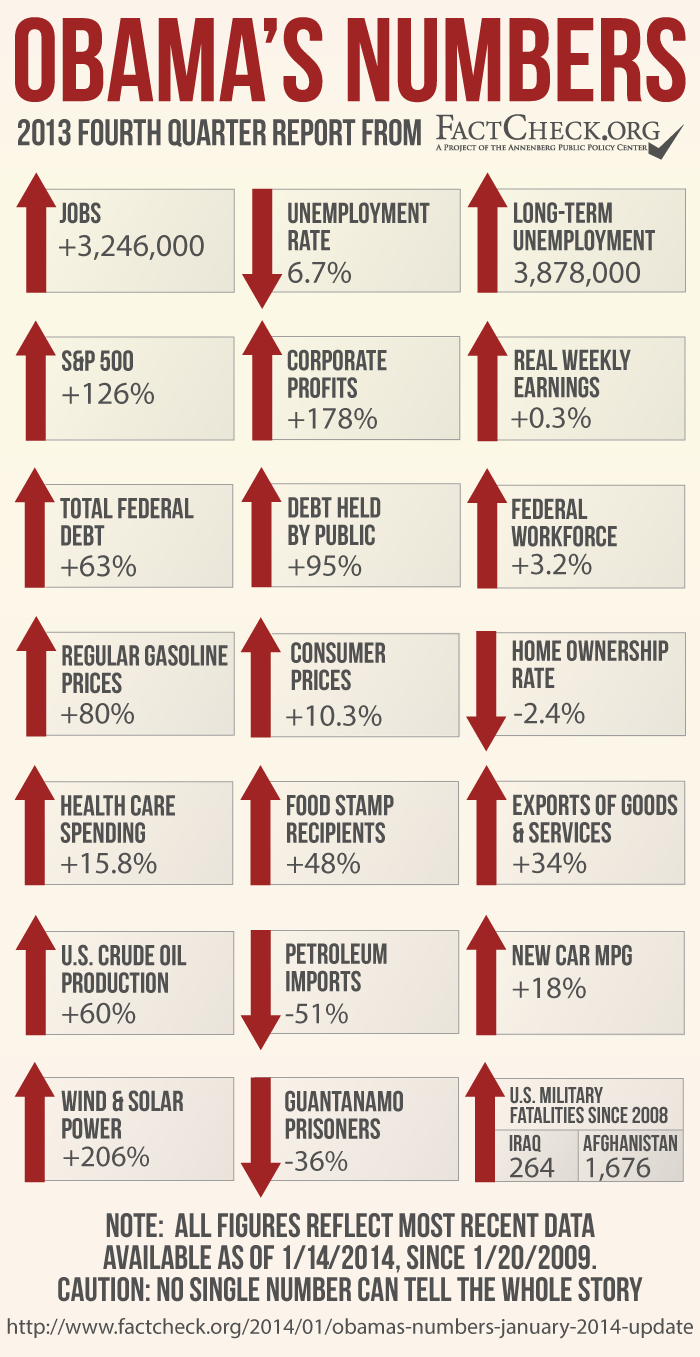
As we do every three months, we are updating our “Obama’s Numbers” report with fresh statistics reflecting what has happened since the president first took office.
Some highlights from this round:
The economy continues to gain jobs, but the number of long-term unemployed is nearly double what it was when Obama became president.
Wages remain stagnant, increasing a scant 0.3 percent after inflation during Obama’s time. Meanwhile corporate profits are running 178 percent higher than just before he took office, and stock prices have doubled.
The number of low-income persons on food stamps remains just below the record level reached in 2012, with 15 percent of the population still getting benefits.
Health care spending has increased 15.8 percent under Obama, which is faster than inflation but modest by historical standards. But there’s scant evidence that the Affordable Care Act is causing the slowdown. The government economists and statisticians who track the spending said the law’s impact has been “minimal.”
U.S. exports have gone up just 34 percent — leaving the president far short of his announced goal of doubling them by the end of this year.
The number of suspected terrorists held prisoner at Guantanamo — which the president once ordered closed by January 2010 — is down only 36 percent.
The federal debt owed to the public has nearly doubled since Obama was sworn in, increasing by 95 percent.

Analysis
This report follows our October 2013 update and previous quarterly reports dating back to our first “Obama’s Numbers” article in October 2012. All figures here reflect the most recent available as of Jan. 14.
Jobs
As of December, the economy had gained a net total of 3,246,000 jobs since Obama first took office, and the unemployment rate had fallen to 6.7 percent, down from 7.8 percent. But that's a misleading stat.
Despite the gains, more than 10 million people remained unemployed, including 3.9 million who had been out of work for 27 weeks or longer. That’s an increase of nearly 1.2 million “long-term unemployed” since the start of the Obama presidency.
The average time that an unemployed person in December had been looking for work was 37 weeks, nearly double the average at the time Obama entered the White House.
Another troubling jobs statistic is the civilian labor force participation rate, which has now declined by 2.9 percentage points since Obama became president, to the lowest point since 1978. But that’s not entirely due to “discouraged workers” dropping out because they believe no jobs are available, as some Obama critics would have you believe.
Other labor-force dropouts include members of the baby-boom generation, who are retiring in droves. They also include disabled workers gaining Social Security disability benefits (a number that has doubled in the past 17 years, and is up 20 percent just since Obama took office).
There’s a lively debate among economists about the causes — and implications — of the shrinking participation rate, which started long before Obama took office. The rate actually peaked in early 2000 and declined 1.5 percent under Obama’s predecessor. A Labor Department economist, looking at current demographic trends, predicts further declines through at least 2022 — long after the end of Obama’s presidency.
Slowing Health Care Costs
Health care costs have risen only moderately since Obama took office, but not for the reason the White House wants you to think.
The most recent official figures were posted by the Centers for Medicare & Medicaid Services, whose nonpartisan economists and statisticians have tracked health care spending since 1960. CMS officials also published their findings in a Jan. 6 article in the journal Health Affairs.
The figures show health care spending in the U.S. rose 3.7 percent in 2012, and stood 15.8 percent higher than it did in 2008, the year before Obama took office.
That’s moderate by historical standards. And the White House was quick to claim credit.
Jason Furman, chairman of the president’s Council of Economic Advisers, published an op-ed piece in the Wall Street Journal Jan. 6 under the headline, “ObamaCare Is Slowing Health Inflation.” In the body of the piece, he argued that the slowdown in health costs is due “in part” to the Affordable Care Act, which he said is making a “meaningful” contribution. He cited, for example, the law’s provision penalizing hospitals if too many patients need to be readmitted, which he said has helped reduce hospital readmission rates by more than 1 percentage point.
But the nonpartisan number-crunchers at CMS said in their Health Affairs article that the ACA had only a “minimal” impact on the slowdown in spending. The reasons they cited instead were:
The economic slowdown and subsequent sluggish recovery
Drops in some prescription drug costs brought about by the expiration of patents on several costly medications including Lipitor, Plavix and Singulair, which are now available in low-cost generic versions, and
A one-time reduction in Medicare payment levels to skilled nursing facilities.
The Health Affairs authors suggested the slowdown in health spending may only be temporary, as has been the case after past recessions.

Health care spending consumed a record 17.4 percent of the nation’s entire economic output in the recession-plagued year of 2009. That declined only slightly, to 17.2 percent, in 2012.
“[T]his pattern is consistent with historical experience when health spending as a share of GDP often stabilizes approximately two to three years after the end of a recession and then increases when the economy significantly improves,” the authors said.
To conclude that the slowdown is permanent, they said, would require “more historical evidence.”
Moderate Inflation
Other costs have risen even more slowly under Obama. As of November, the Consumer Price Index has risen 10.3 percent since he first took office. Some policymakers even worry the inflation rate might be too low — foreshadowing sluggish economic growth in the future.
The highly visible (and highly volatile and highly politicized) price of regular gasoline stood at a national average of $3.33 per gallon in the week ended Jan. 13. That’s more than half a buck cheaper than it was in September 2012, when Republicans were making it an election issue. The recent price is 80 percent higher than it was when Obama took office in the midst of a worldwide recession, which had dampened demand. But the price under Obama has never equaled the historic high of more than $4 per gallon that it reached in June and July 2008, before he took office.
Disappointing Exports
The president has a long way to go to meet his goal of doubling exports of U.S. goods and services, which he first made in his 2010 State of the Union address. So far, exports have increased only 33.6 percent since Obama took office, according to data from the U.S. Commerce Department. (We compared seasonally adjusted figures for the fourth quarter of 2008 with those for the July – September quarter of 2013, the most recent figures available.)
Obama is facing the same global economic headwinds that he did six months ago, when we last updated the export figure. Simply put, overseas customers are still struggling. European unemployment is stuck at 12 percent, for example. And China’s economic growth has slowed and remains problematic. The president mentions his 2010 National Export Initiative on occasion. But at the current rate he won’t come close to meeting his original goal of doubling exports by the end of 2014.
Rising Federal Debt
The president is fond of boasting that annual federal deficits are falling rapidly. But they remain large by historical standards. And the fact is, they are piling up.
Total federal debt now stands at nearly $17.3 trillion, which is 63 percent higher than when Obama took office. That figure includes money the government owes to itself, chiefly through the Social Security trust funds.
A figure that economists consider more important — the debt the government owes to the public — has risen even more dramatically. That figure now stands at $12.3 trillion, an increase of 95 percent under Obama. At the current rate it will surely rise to a doubling during Obama’s presidency — possibly by the time of our next update three months hence.
Net interest payments consumed 6.4 percent of all federal spending in the fiscal year that ended Sept. 30. And the nonpartisan Congressional Budget Office officially projects that interest payments will gobble up an even bigger share of federal spending in the future. “CBO expects interest rates to rebound in coming years from their current unusually low levels, sharply raising the government’s cost of borrowing,” CBO said in its most recent long-term budget outlook document.
Government Workers
While cash-strapped state and local governments have been laying off teachers, firefighters, police and other workers, the federal government has increased the number of its employees under Obama.
The most recent figures from the Bureau of Labor Statistics show that as of December, workers on the federal payroll (excluding postal workers) numbered more than 2.1 million, up 3.2 percent since January 2009.
During the same time, the number of workers on state payrolls went down 3 percent and those on local government payrolls declined by 3.5 percent. A big reason for the disparity is that state and local governments generally must balance their spending and income each year, while the federal government can keep up spending by borrowing.
The figures also show that in recent months state and federal governments have been able to hire back some of their laid-off workers. Obama’s hiring spree also peaked in 2011 (ignoring spikes in hiring of temporary Census workers in 2010), and the number of non-postal federal workers has gone down more or less steadily during the budget battles of the past two years. But the number is above where it was when he took office.
Stagnant Wages, Record Corporate Profits
The divide between the affluent and ordinary wage earners — which the president last month called the “defining challenge of our time” — has widened during his time in office.
Wages remain stagnant, barely keeping up with inflation. Average weekly earnings of workers on payrolls, measured in inflation-adjusted dollars, have edged up a scant 0.3 percent between Obama’s first month in office and November 2013, the most recent on record. And there’s no clear upward trend. We reported a 0.1 percent increase in the real earnings figure in our July update six months ago, but that had evaporated by the time of our October update three months later, when the figure was exactly zero.
Relatively fewer people now own their own homes. Under Obama, the home ownership rate has declined by 2.4 percentage points, to 65.1 percent in the July-September quarter, according to U.S. Census figures. (The decline actually began in 2004, when the rate peaked at 69.4 percent as the housing bubble was inflating.)
And the number of low-income persons on food stamps (now called Supplemental Nutrition Assistance, or SNAP) continues at near-record levels. The most recent figures from the Department of Agriculture put the number receiving benefits at just over 47.4 million as of October — or 15 percent of the entire U.S. population.
That’s down a bit from the nearly 47.8 million record set in December 2012. But it is still an increase of 48.3 percent during Obama’s presidency.
The increase in food stamp beneficiaries is due partly to economic pressures, but also to liberalizations in both benefits and eligibility under President Obama and also under his predecessor. We covered those in some detail back in 2012 when GOP presidential candidate Newt Gingrich accused Obama of being the “food stamp president.” The number of food stamp beneficiaries increased by 14.7 million during Bush’s two terms in office, and is up another 15.4 million under Obama.
One factor behind Obama’s increase is that benefit levels were raised in 2009 as part of his economic stimulus program. That “temporary” increase was extended several times, and didn’t lapse until Nov. 1 last year.
But while wage earners and low-income people struggle, corporate profits keep setting records. Even after taxes, corporate profits were running at an annual rate of nearly $1.9 trillion in the July-September quarter of last year, the most recent for which figures are available. That’s nearly triple the rate during the three months before Obama became president — an increase of 178 percent.
To be sure, that last quarter of 2008 was the worst since 2002, thanks to the worst business recession since the Great Depression. But profits rebounded to well above previous levels. Profits in the most recent quarter were running 33 percent higher than the highest level seen before 2009, which was the third quarter of 2006, when profits ran at a rate of $1.4 trillion.
Obama’s time in office also has been good for those who own corporate stocks — whose values have doubled and more under Obama. As of the close of the market on Jan. 14, the Standard & Poor’s 500 stock index was 128 percent higher than it was when Obama first took office.
Other market indicators also have soared. The Dow Jones Industrial Average was up 106 percent, and the NASDAQ Composite index had nearly tripled, rising by 190 percent.
Booming Oil, Gas, Wind and Solar
The remarkable and historic boom in U.S. oil and gas production continues. Production of crude oil in the U.S. now has increased 60 percent since Obama took office, while imports of foreign oil and petroleum products have declined by 51 percent, as measured by the most recent Energy Information Administration figures, comparing the most recent three-month period with the last quarter of 2008.
As a consequence, U.S. dependency on imported oil has dropped sharply. The nation imported 34 percent of what it consumed in the first 11 months of 2011, according to the most recent EIA figures. (See Table 3.3a, “net imports” as a percent of “product supplied.”) That’s a drop of 23 percentage points from 2008, when the U.S. imported 57 percent. The decline actually began in George W. Bush’s second term, after U.S. dependency peaked at 60.3 percent in 2005. But the trend has gathered momentum under Obama.
As we’ve said before, the U.S. energy boom is a result primarily of the use of new drilling technology by the industry, not of any policy changes in Washington. But the president hasn’t been in any hurry to impose restrictions on the hydraulic fracturing method. The Environmental Protection Agency has been studying the impact of “fracking” on drinking water for years. It announced the study March 18, 2010, and issued a “progress report” Dec. 21, 2012. The EPA says it expects a draft report to be released for scientific peer review sometime this year.
Another factor behind reduced U.S. dependency on imported oil is more fuel-efficient automobiles. The latest figures from the University of Michigan’s Transportation Research Institute show the average EPA city/highway “window sticker” mileage of cars and light trucks sold in December was 24.8 miles per gallon, an improvement of 18 percent over the average for vehicles sold in the month that Obama took office.
Washington is now calling for even greater efficiency in the future. The Obama administration has put in place requirements that cars and light trucks average 54.5 mpg by model year 2025. But it remains to be seen whether the industry can produce such vehicles and get Americans to buy them, and whether future presidents will stick to Obama’s ambitious goal.
Under Obama, wind and solar power has tripled. In the most recent 12 months on record (ending in October) electricity generated by wind and solar had increased by 206 percent over the total for 2008. That was spurred in part by large federal tax subsidies for wind and solar generation.
Despite the large percentage increase in wind and solar generation, such energy accounted for just under 3.2 percent of all electricity generated in the U.S. in the July-September quarter of 2013, the most recent on record. Coal still accounts for the biggest share, followed by natural gas and nuclear power.
War and Terrorism
The detention facility for suspected terrorists remains open at the Guantanamo Naval Base in Cuba, despite the order Obama signed two days after taking office, directing that it be closed within one year. On Dec. 31 the U.S. announced it was releasing three more prisoners — all ethnic Uighur Chinese nationals — and transferring them to Slovakia, which had agreed to resettle them. But that leaves 155 “detainees” in custody (the Pentagon prefers not to call them “prisoners”), a number just 36 percent below the 242 who were being held nearly five years ago when Obama became president.
And the war in Afghanistan grinds on. According to official Pentagon figures, the U.S. has suffered a total of 1,676 military fatalities since 2008 in Operation Enduring Freedom.
Since 2008, a total of 264 U.S. military fatalities were attributed to the two Iraq war operations, Operation Iraqi Freedom and Operation New Dawn, according to official Pentagon figures. Although the last U.S. troops left Iraq at the end of 2011, two deaths were attributed to the conflict in 2012: Marine Staff Sgt. Oscar Eduardo Canon, who died in February 2012 of wounds suffered earlier, and Army Staff Sgt. Ahmed Kousay al-Taie, who had been missing since 2006 and whose remains were identified in February 2012.
– by Brooks Jackson
January 15, 2014 / FACTCHECK.org
Summary
As we do every three months, we are updating our “Obama’s Numbers” report with fresh statistics reflecting what has happened since the president first took office.
Some highlights from this round:
The economy continues to gain jobs, but the number of long-term unemployed is nearly double what it was when Obama became president.
Wages remain stagnant, increasing a scant 0.3 percent after inflation during Obama’s time. Meanwhile corporate profits are running 178 percent higher than just before he took office, and stock prices have doubled.
The number of low-income persons on food stamps remains just below the record level reached in 2012, with 15 percent of the population still getting benefits.
Health care spending has increased 15.8 percent under Obama, which is faster than inflation but modest by historical standards. But there’s scant evidence that the Affordable Care Act is causing the slowdown. The government economists and statisticians who track the spending said the law’s impact has been “minimal.”
U.S. exports have gone up just 34 percent — leaving the president far short of his announced goal of doubling them by the end of this year.
The number of suspected terrorists held prisoner at Guantanamo — which the president once ordered closed by January 2010 — is down only 36 percent.
The federal debt owed to the public has nearly doubled since Obama was sworn in, increasing by 95 percent.
Analysis
This report follows our October 2013 update and previous quarterly reports dating back to our first “Obama’s Numbers” article in October 2012. All figures here reflect the most recent available as of Jan. 14.
Jobs
As of December, the economy had gained a net total of 3,246,000 jobs since Obama first took office, and the unemployment rate had fallen to 6.7 percent, down from 7.8 percent. But that's a misleading stat.
Despite the gains, more than 10 million people remained unemployed, including 3.9 million who had been out of work for 27 weeks or longer. That’s an increase of nearly 1.2 million “long-term unemployed” since the start of the Obama presidency.
The average time that an unemployed person in December had been looking for work was 37 weeks, nearly double the average at the time Obama entered the White House.
Another troubling jobs statistic is the civilian labor force participation rate, which has now declined by 2.9 percentage points since Obama became president, to the lowest point since 1978. But that’s not entirely due to “discouraged workers” dropping out because they believe no jobs are available, as some Obama critics would have you believe.
Other labor-force dropouts include members of the baby-boom generation, who are retiring in droves. They also include disabled workers gaining Social Security disability benefits (a number that has doubled in the past 17 years, and is up 20 percent just since Obama took office).
There’s a lively debate among economists about the causes — and implications — of the shrinking participation rate, which started long before Obama took office. The rate actually peaked in early 2000 and declined 1.5 percent under Obama’s predecessor. A Labor Department economist, looking at current demographic trends, predicts further declines through at least 2022 — long after the end of Obama’s presidency.
Slowing Health Care Costs
Health care costs have risen only moderately since Obama took office, but not for the reason the White House wants you to think.
The most recent official figures were posted by the Centers for Medicare & Medicaid Services, whose nonpartisan economists and statisticians have tracked health care spending since 1960. CMS officials also published their findings in a Jan. 6 article in the journal Health Affairs.
The figures show health care spending in the U.S. rose 3.7 percent in 2012, and stood 15.8 percent higher than it did in 2008, the year before Obama took office.
That’s moderate by historical standards. And the White House was quick to claim credit.
Jason Furman, chairman of the president’s Council of Economic Advisers, published an op-ed piece in the Wall Street Journal Jan. 6 under the headline, “ObamaCare Is Slowing Health Inflation.” In the body of the piece, he argued that the slowdown in health costs is due “in part” to the Affordable Care Act, which he said is making a “meaningful” contribution. He cited, for example, the law’s provision penalizing hospitals if too many patients need to be readmitted, which he said has helped reduce hospital readmission rates by more than 1 percentage point.
But the nonpartisan number-crunchers at CMS said in their Health Affairs article that the ACA had only a “minimal” impact on the slowdown in spending. The reasons they cited instead were:
The economic slowdown and subsequent sluggish recovery
Drops in some prescription drug costs brought about by the expiration of patents on several costly medications including Lipitor, Plavix and Singulair, which are now available in low-cost generic versions, and
A one-time reduction in Medicare payment levels to skilled nursing facilities.
The Health Affairs authors suggested the slowdown in health spending may only be temporary, as has been the case after past recessions.
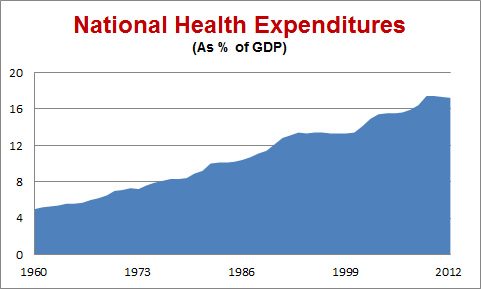
Health care spending consumed a record 17.4 percent of the nation’s entire economic output in the recession-plagued year of 2009. That declined only slightly, to 17.2 percent, in 2012.
“[T]his pattern is consistent with historical experience when health spending as a share of GDP often stabilizes approximately two to three years after the end of a recession and then increases when the economy significantly improves,” the authors said.
To conclude that the slowdown is permanent, they said, would require “more historical evidence.”
Moderate Inflation
Other costs have risen even more slowly under Obama. As of November, the Consumer Price Index has risen 10.3 percent since he first took office. Some policymakers even worry the inflation rate might be too low — foreshadowing sluggish economic growth in the future.
The highly visible (and highly volatile and highly politicized) price of regular gasoline stood at a national average of $3.33 per gallon in the week ended Jan. 13. That’s more than half a buck cheaper than it was in September 2012, when Republicans were making it an election issue. The recent price is 80 percent higher than it was when Obama took office in the midst of a worldwide recession, which had dampened demand. But the price under Obama has never equaled the historic high of more than $4 per gallon that it reached in June and July 2008, before he took office.
Disappointing Exports
The president has a long way to go to meet his goal of doubling exports of U.S. goods and services, which he first made in his 2010 State of the Union address. So far, exports have increased only 33.6 percent since Obama took office, according to data from the U.S. Commerce Department. (We compared seasonally adjusted figures for the fourth quarter of 2008 with those for the July – September quarter of 2013, the most recent figures available.)
Obama is facing the same global economic headwinds that he did six months ago, when we last updated the export figure. Simply put, overseas customers are still struggling. European unemployment is stuck at 12 percent, for example. And China’s economic growth has slowed and remains problematic. The president mentions his 2010 National Export Initiative on occasion. But at the current rate he won’t come close to meeting his original goal of doubling exports by the end of 2014.
Rising Federal Debt
The president is fond of boasting that annual federal deficits are falling rapidly. But they remain large by historical standards. And the fact is, they are piling up.
Total federal debt now stands at nearly $17.3 trillion, which is 63 percent higher than when Obama took office. That figure includes money the government owes to itself, chiefly through the Social Security trust funds.
A figure that economists consider more important — the debt the government owes to the public — has risen even more dramatically. That figure now stands at $12.3 trillion, an increase of 95 percent under Obama. At the current rate it will surely rise to a doubling during Obama’s presidency — possibly by the time of our next update three months hence.
Net interest payments consumed 6.4 percent of all federal spending in the fiscal year that ended Sept. 30. And the nonpartisan Congressional Budget Office officially projects that interest payments will gobble up an even bigger share of federal spending in the future. “CBO expects interest rates to rebound in coming years from their current unusually low levels, sharply raising the government’s cost of borrowing,” CBO said in its most recent long-term budget outlook document.
Government Workers
While cash-strapped state and local governments have been laying off teachers, firefighters, police and other workers, the federal government has increased the number of its employees under Obama.
The most recent figures from the Bureau of Labor Statistics show that as of December, workers on the federal payroll (excluding postal workers) numbered more than 2.1 million, up 3.2 percent since January 2009.
During the same time, the number of workers on state payrolls went down 3 percent and those on local government payrolls declined by 3.5 percent. A big reason for the disparity is that state and local governments generally must balance their spending and income each year, while the federal government can keep up spending by borrowing.
The figures also show that in recent months state and federal governments have been able to hire back some of their laid-off workers. Obama’s hiring spree also peaked in 2011 (ignoring spikes in hiring of temporary Census workers in 2010), and the number of non-postal federal workers has gone down more or less steadily during the budget battles of the past two years. But the number is above where it was when he took office.
Stagnant Wages, Record Corporate Profits
The divide between the affluent and ordinary wage earners — which the president last month called the “defining challenge of our time” — has widened during his time in office.
Wages remain stagnant, barely keeping up with inflation. Average weekly earnings of workers on payrolls, measured in inflation-adjusted dollars, have edged up a scant 0.3 percent between Obama’s first month in office and November 2013, the most recent on record. And there’s no clear upward trend. We reported a 0.1 percent increase in the real earnings figure in our July update six months ago, but that had evaporated by the time of our October update three months later, when the figure was exactly zero.
Relatively fewer people now own their own homes. Under Obama, the home ownership rate has declined by 2.4 percentage points, to 65.1 percent in the July-September quarter, according to U.S. Census figures. (The decline actually began in 2004, when the rate peaked at 69.4 percent as the housing bubble was inflating.)
And the number of low-income persons on food stamps (now called Supplemental Nutrition Assistance, or SNAP) continues at near-record levels. The most recent figures from the Department of Agriculture put the number receiving benefits at just over 47.4 million as of October — or 15 percent of the entire U.S. population.
That’s down a bit from the nearly 47.8 million record set in December 2012. But it is still an increase of 48.3 percent during Obama’s presidency.
The increase in food stamp beneficiaries is due partly to economic pressures, but also to liberalizations in both benefits and eligibility under President Obama and also under his predecessor. We covered those in some detail back in 2012 when GOP presidential candidate Newt Gingrich accused Obama of being the “food stamp president.” The number of food stamp beneficiaries increased by 14.7 million during Bush’s two terms in office, and is up another 15.4 million under Obama.
One factor behind Obama’s increase is that benefit levels were raised in 2009 as part of his economic stimulus program. That “temporary” increase was extended several times, and didn’t lapse until Nov. 1 last year.
But while wage earners and low-income people struggle, corporate profits keep setting records. Even after taxes, corporate profits were running at an annual rate of nearly $1.9 trillion in the July-September quarter of last year, the most recent for which figures are available. That’s nearly triple the rate during the three months before Obama became president — an increase of 178 percent.
To be sure, that last quarter of 2008 was the worst since 2002, thanks to the worst business recession since the Great Depression. But profits rebounded to well above previous levels. Profits in the most recent quarter were running 33 percent higher than the highest level seen before 2009, which was the third quarter of 2006, when profits ran at a rate of $1.4 trillion.
Obama’s time in office also has been good for those who own corporate stocks — whose values have doubled and more under Obama. As of the close of the market on Jan. 14, the Standard & Poor’s 500 stock index was 128 percent higher than it was when Obama first took office.
Other market indicators also have soared. The Dow Jones Industrial Average was up 106 percent, and the NASDAQ Composite index had nearly tripled, rising by 190 percent.
Booming Oil, Gas, Wind and Solar
The remarkable and historic boom in U.S. oil and gas production continues. Production of crude oil in the U.S. now has increased 60 percent since Obama took office, while imports of foreign oil and petroleum products have declined by 51 percent, as measured by the most recent Energy Information Administration figures, comparing the most recent three-month period with the last quarter of 2008.
As a consequence, U.S. dependency on imported oil has dropped sharply. The nation imported 34 percent of what it consumed in the first 11 months of 2011, according to the most recent EIA figures. (See Table 3.3a, “net imports” as a percent of “product supplied.”) That’s a drop of 23 percentage points from 2008, when the U.S. imported 57 percent. The decline actually began in George W. Bush’s second term, after U.S. dependency peaked at 60.3 percent in 2005. But the trend has gathered momentum under Obama.
As we’ve said before, the U.S. energy boom is a result primarily of the use of new drilling technology by the industry, not of any policy changes in Washington. But the president hasn’t been in any hurry to impose restrictions on the hydraulic fracturing method. The Environmental Protection Agency has been studying the impact of “fracking” on drinking water for years. It announced the study March 18, 2010, and issued a “progress report” Dec. 21, 2012. The EPA says it expects a draft report to be released for scientific peer review sometime this year.
Another factor behind reduced U.S. dependency on imported oil is more fuel-efficient automobiles. The latest figures from the University of Michigan’s Transportation Research Institute show the average EPA city/highway “window sticker” mileage of cars and light trucks sold in December was 24.8 miles per gallon, an improvement of 18 percent over the average for vehicles sold in the month that Obama took office.
Washington is now calling for even greater efficiency in the future. The Obama administration has put in place requirements that cars and light trucks average 54.5 mpg by model year 2025. But it remains to be seen whether the industry can produce such vehicles and get Americans to buy them, and whether future presidents will stick to Obama’s ambitious goal.
Under Obama, wind and solar power has tripled. In the most recent 12 months on record (ending in October) electricity generated by wind and solar had increased by 206 percent over the total for 2008. That was spurred in part by large federal tax subsidies for wind and solar generation.
Despite the large percentage increase in wind and solar generation, such energy accounted for just under 3.2 percent of all electricity generated in the U.S. in the July-September quarter of 2013, the most recent on record. Coal still accounts for the biggest share, followed by natural gas and nuclear power.
War and Terrorism
The detention facility for suspected terrorists remains open at the Guantanamo Naval Base in Cuba, despite the order Obama signed two days after taking office, directing that it be closed within one year. On Dec. 31 the U.S. announced it was releasing three more prisoners — all ethnic Uighur Chinese nationals — and transferring them to Slovakia, which had agreed to resettle them. But that leaves 155 “detainees” in custody (the Pentagon prefers not to call them “prisoners”), a number just 36 percent below the 242 who were being held nearly five years ago when Obama became president.
And the war in Afghanistan grinds on. According to official Pentagon figures, the U.S. has suffered a total of 1,676 military fatalities since 2008 in Operation Enduring Freedom.
Since 2008, a total of 264 U.S. military fatalities were attributed to the two Iraq war operations, Operation Iraqi Freedom and Operation New Dawn, according to official Pentagon figures. Although the last U.S. troops left Iraq at the end of 2011, two deaths were attributed to the conflict in 2012: Marine Staff Sgt. Oscar Eduardo Canon, who died in February 2012 of wounds suffered earlier, and Army Staff Sgt. Ahmed Kousay al-Taie, who had been missing since 2006 and whose remains were identified in February 2012.
– by Brooks Jackson
Sources
Bureau of Labor Statistics. “Employment, Hours, and Earnings from the Current Employment Statistics survey (National); Total Nonfarm Employment, Seasonally Adjusted.” Data extracted 14 Jan 2014.
Bureau of Labor Statistics. “Labor Force Statistics from the Current Population Survey; Unemployment Rate, Seasonally Adjusted.” Data extracted 14 Jan 2014.
Bureau of Labor Statistics. “Labor Force Statistics from the Current Population Survey; Unemployment Level, Seasonally Adjusted.” Data extracted 14 Jan 2014.
Bureau of Labor Statistics. “Labor Force Statistics from the Current Population Survey; Number Unemployed for 27 Weeks & Over, Seasonally Adjusted.” Data extracted 14 Jan 2014.
Bureau of Labor Statistics. “Labor Force Statistics from the Current Population Survey; Labor Force Participation Rate, Seasonally Adjusted.” Data extracted 14 Jan 2014.
Bureau of Labor Statistics. “Labor Force Statistics from the Current Population Survey; Not in Labor Force, Searched For Work and Available, Discouraged Reasons For Not Currently Looking, Unadjusted.” Data extracted 14 Jan 2014.
Social Security Administration. “Number of Social Security recipients—time series for selected benefit type: Disabled Workers.” Data extracted 14 Jan 2014.
Klein, Matthew C. “Is Jobless Rate Really Falling?” Bloomberg News. 9 Jan 2014.
Toossi, Mitra. “Labor force projections to 2022: the labor force participation rate continues to fall.” Monthly Labor Review. Dec 2013.
Martin, Anne B. and Micah Hartman, Lekha Whittle, Aaron Catlin and the National Health Expenditure Accounts Team. “National Health Spending In 2012: Rate Of Health Spending Growth Remained Low For The Fourth Consecutive Year.” Health Affairs. Jan 2014.
Furman, Jason. “ObamaCare Is Slowing Health Inflation.” Wall Street Journal. 6 Jan 2014.
Petrof, Alanna. “Euro zone unemployment at 12%, while U.S. improving.” CNN Money. 8 Jan 2014.
“China’s Stocks Fall to Five-Month Low on Economic Growth Concern.” Bloomberg News. 5 Jan 2014.
White House. “Remarks by the President in the State of the Union.” 27 Jan 2010.
Bureau of Labor Statistics. “Consumer Price Index – All Urban Consumers.” Data extracted 14 Jan 2014.
“Inflation, Strangely Low, Holds Key to 2014 Fed Policy.” Thompson/Reuters. 12 Jan 2014.
U.S. Energy Information Administration. “Weekly U.S. Regular All Formulations Retail Gasoline Prices.” Data extracted 14 Jan 2014.
Obama, Barack “Remarks by the President in State of the Union Address.” White House Office of the Press Secretary. 27 Jan 2010.
Petroff, Alanna. “Euro zone unemployment at 12%, while U.S. improving.” CNN Money. 8 Jan 2014.
“China’s Stocks Fall to Five-Month Low on Economic Growth Concern.” Bloomberg News. 5 Jan 2014.
U.S. Treasury. “The Debt to the Penny and Who Holds It.” 10 Jan 2014. Data extracted 14 Jan 2014.
U.S. Treasury. “Final Monthly Treasury Statement of Receipts and Outlays of the United States Government For Fiscal Year 2013 Through September 30, 2013, and Other Periods.” Undated. Accessed 14 Jan 2014.
Congressional Budget Office. “The 2013 Long Term Budget Outlook.” Sept 2013.
Bureau of Labor Statistics. “Employment, Hours, and Earnings from the Current Employment Statistics survey (National); Government, Federal, except U.S. Postal Service, Seasonally Adjusted.” Data extracted 14 Jan 2014.
Bureau of Labor Statistics. “Employment, Hours, and Earnings from the Current Employment Statistics survey (National); Government, State Government, Seasonally Adjusted.” Data extracted 14 Jan 2014.
Bureau of Labor Statistics. “Employment, Hours, and Earnings from the Current Employment Statistics survey (National); Government, Local Government, Seasonally Adjusted.” Data extracted 14 Jan 2014.
Obama, Barack. “Remarks by the President on Economic Mobility.” White House Office of the Press Secretary. 4 Dec 2013.
Bureau of Labor Statistics. “Employment, Hours, and Earnings from the Current Employment Statistics survey (National); Average Weekly Earnings of All Employees, 1982-1984 Dollars.” Data extracted 14 Jan 2014.
U.S. Census Bureau. “Time Series: Seasonally Adjusted Home Ownership Rate.” Data extracted 14 Jan 2014.
U.S. Department of Agriculture, Food and Nutrition Service. “Supplemental Nutrition Assistance Program (Data as of January 10, 2014).” Data extracted 14 Jan 2014.
Plumber, Brad. “Food stamps will get cut by $5 billion this week — and more cuts could follow.” Washington Post Wonkblog. 28 Oct 2013.
Federal Reserve Bank of St Louis. “Corporate Profits After Tax (without IVA and CCAdj) (CP).” Data extracted 14 Jan 2014.
Google Finance. “S&P 500.” Historical prices. Accessed 14 Jan 2014.
Google Finance. “Dow Jones Industrial Average.” Historical prices. Accessed 14 Jan 2014.
Google Finance. “NASDAQ Composite.” Historical prices. Accessed 14 Jan 2014.
U.S. Energy Information Administration. “U.S. Crude Oil Production.” Accessed 14 Jan 2014.
U.S. Energy Information Administration. “Table 3.3a. Monthly Energy Review.” Dec 2013.
U.S. Energy Information Administration. “Table 1.1.A. Net Generation by Other Renewables: Total (All Sectors), 2003-April 2013.” Accessed 14 Jan 2014.
U.S. Environmental Protection Agency. “EPA Initiates Hydraulic Fracturing Study: Agency seeks input from Science Advisory Board.” News release. 18 Mar 2010.
U.S. Environmental Protection Agency. “EPA Releases Update on Ongoing Hydraulic Fracturing Study.” News release. 21 Dec 2012.
University of Michigan Transportation Research Institute. “Average sales-weighted fuel-economy rating (window sticker) of purchased new vehicles for October 2007 through December 2013.” 8 Jan 2014.
“Obama Administration Finalizes Historic 54.5 MPG Fuel Efficiency Standards.” News release, White House Office of the Press Secretary. 28 Aug 2012.
U.S. Energy Information Administration. “Electric Power Monthly: Table 1.1.A. Net Generation from Renewable Sources: Total (All Sectors), 2003-October 2013.” 20 Dec 2013.
U.S. Energy Information Administration. “Electricity Data Browser: Net Generation.” Data extracted 14 Jan 2014.
“Closure Of Guantanamo Detention Facilities: Executive Order – Review and Disposition of Individuals Detained at the Guantanamo Bay Naval Base and Closure of Detention Facilities.” The White House. 22 Jan 2009.
U.S. Department of Defense. “Detainee Transfer Announced.” News release. 31 Dec 2013.
U.S. Department of Defense, Defense Casualty Analysis System. “U.S. Military Casualties – Operation Enduring Freedom (OEF) Casualty Summary by Month.” Data extracted 14 Jan 2014.
U.S. Department of Defense, Defense Casualty Analysis System. “U.S. Military Casualties – Operation Iraqi Freedom (OIF) Casualty Summary by Month.” Data extracted 14 Jan 2014.
U.S. Department of Defense, Defense Casualty Analysis System. “U.S. Military Casualties - Operation New Dawn (OND) Casualty Summary by Month.” Data extracted 14 Jan 2014.
Shapiro, Joseph. “Remembering Marine Sgt. Oscar Canon, A ‘Superstar.’ ” National Public Radio. 24 Feb 2012.
“Missing U.S. soldier killed by Shiite group.” The Associated Press. 27 Feb 2012.


