Showing posts with label U6. Show all posts

Monday, March 16, 2015

Tackling The Real Unemployment Rate: 11%

Louis Efron - Forbes

Imagine being served your poolside drinks by a lawyer, or getting your chicken sandwich delivered by an experienced marketing professional. The first is a friend of mine, the second my waitress a few weeks ago. Both lost jobs due to economic downturns at their organizations. Both took available work to pay the bills while looking for new positions in their chosen professions.

My friend and the waitress are victims of a massive but hidden problem called underemployment. Watching falling unemployment numbers being reported at 5.5%, down from nearly 10% four years earlier, is simply misleading.

Despite the significant decrease in the official U.S. Bureau of Labor Statistics (BLS) unemployment rate, the real unemployment rate is over double that at 11%. This number reflects the government’sU-6report, which accounts for the full unemployment picture including those “marginally attached to the labor force,” plus those “employed part time for economic reasons.”

English: Bureau of Labor Statistics measuremen...
U.S. Bureau of Labor Statistics measurements U1, U2, U3, U4, U5 and U6. (Photo credit: Wikipedia)

Marginally attached” describes individuals not currently in the labor force who wanted and were available for work. The official unemployment numbers exclude them, because they did not look for work in the 4 weeks preceding the unemployment survey. In February, this marginally attached group accounted for 1.052 million people. To put that in perspective, there are currently 8 states in the U.S. with populations smaller than 1.052 million.

302,000 discouraged workers – workers not currently looking for work because they believe no jobs are available for them – are included within the list of marginally attached people. Another 6.635 million were not considered unemployed because they were employed part-time for economic reasons. Those people are also called involuntary part-time workers – working part-time because their hours were cut back or because they were unable to secure a full-time job.

When you look at state populations – using the 6.635 million – the number represents more than the population of all but the 14 states with the highest populations.

These numbers mean the U.S. has over 7 million workers only marginally engaged in their work situation.

They don’t contribute their full potential to their households, the economy or society in general. While reporting a low, declining unemployment number may comfort people, we can’t ignore the millions of workers feeling the pain of the real unemployment number of 11%.

Dan Diamond’s Forbes article, Why The ‘Real’ Unemployment Rate Is Higher Than You Think highlights another disturbing fact that compounds the challenge: The longer you’re without a job, the less likely you’ll get called back for an interview. By the eighth month of unemployment the callback rate falls by about 45%. The article concludes “many employers see these would-be workers as damaged goods.”

These same people could be contributing greatly to the economy. Instead, they are spending their days trying to secure employment or working in unfulfilling part-time jobs while depleting their savings and 401K’s to supplement their income. Or worse yet, living off their credit cards just to survive.

The answer to these challenges is not solely job creation, but creating the right jobs to maximize a labor force.

Here is the solution:

Quality Over Quantity

Getting people back to work is good, but if the quality of their employment is down or the money earned insufficient you create other problems:
  • unsatisfied and disengaged workers
  • low productivity and work quality
  • high turnover and operating costs
  • financial, social, and household strain
To create quality jobs there must be an accurate window into the people needing work, not just programs in place to retrain highly skilled and experienced workers for low-skilled jobs. Retraining should be available, but for those truly desiring a new career. There must be an effort by employers to fully utilize and capitalize on the talents their potential employees can bring to their organizations.

When interviewing candidates – or evaluating your current workforce – look beyond the role they are pursuing or filling. Assess what else they can deliver for your organization. What skills and experiences are they not using in their current role? Is there a way to expand their current jobs to include and leverage missed opportunities? Paying attention to what is on a candidate’s and employee’s resume, closely observing their work, and asking good questions about other contributions they feel they can make are effective ways of performing this assessment.

Post assessment, work-sharing and job rotation programs provide employees a chance to apply unused but valuable experience and to contribute at higher levels.


High-Skilled Jobs Promote Healthy Economies

While governments may believe low unemployment is the key to economic success, it has not proven true. In 24/7 Wall St.’s article Nine Countries Where Everyone Has A Job, a highlighted 2012 study concluded: “only a minority of the countries with low unemployment actually have a healthy economy where middle-class jobs are abundant.” These middle-class, higher skilled jobs tend to have a greater impact on innovation, productivity and improved efficiency.

After World War II, Europe’s economy recovered quickly despite its destroyed factories and infrastructure. This was primarily due to maximizing and strategically leveraging the experienced workforce.

Unlike investing in machines – which need replacing over time – human knowledge becomes stronger and more valuable the more it is used and developed. Highly skilled people grow weaker and become less valuable to our economy when they spend their days looking for work or occupied in jobs that don’t further develop and hone their capabilities.

A product designer spending 40 hours a week pondering and developing new products – plus getting additional training – will become more creative, knowledgeable and innovative. He/she will also add further value to their organization the more they work in their job.

An assembly line worker instructed to repeat the same required task over and over has little room to add more value to him/herself or their organization. Except for their own assertively offered suggestions, that worker may only add value when their task alters as a result of innovations from higher-skilled workers. While the product designer can help other product designers around him or her get better; the assembly line worker may again be limited by the job and unable to effect change in the same way.


Innovation First

In the early 1900s, economist Joseph Schumpeter coined the term “creative destruction” – occurring when something new destroys something older. When an organization creates a new product or finds a better way of doing something, it can eliminate its competition. The invention of the personal computer is a great example of this. Many mainframe computer companies became obsolete when the personal computer arrived. On the other hand, that creation allowed new organizations and jobs to develop.

The invention of photography revolutionized the world, eliminating some professions, but creating many new ones. Before photography, some prisons employed “recognizing officers” – people who identified repeat offenders. With cameras obtainable and affordable, photographers replaced the recognizing officer to process mug shots of each prisoner.

Schumpeter asserted that the “process of creative destruction is the essential fact about capitalism.” It is ebb and flow; a recreation or a rebirth sustained by constant innovation. As new ideas come to life, so do new industries, organizations and jobs. To keep innovative people working, organizations and governments must create jobs for them and invest in their progressive ideas.

Governments and organizations that create quality, high-skilled jobs focused on innovation will yield more of the right jobs, engage their entire workforce, and ultimately create a diversity of jobs at all levels. Creating such jobs is key to economic growth and sustainability. This, in turn, will fulfill the needs of the underemployed who desperately want to make a difference to their communities and the world.

If a country loses its most educated and skilled people to other countries due to a lack of fulfilling jobs, that economy will stagnate.


Facing Reality

Technology will change the jobs we do.

While secretaries, telephone operators, word processors and typists were rapidly disappearing between 2000 and 2010, employment in computer systems design and related services grew by a healthy 18% around the same period (BLS). The emerging sector even withstood the recent recession losing only 1% of its workforce during the downturn. From 2003 to 2013, BLS reported 37 percent employment growth in the IT industry.

Highly skilled innovators that dream-up and advance our future will create new jobs and industries. The more high skilled jobs there are, the lower both unemployment and underemployment will become.

Thursday, July 10, 2014

Virtual Economy’s Phantom Job Gains Are Based on Statistical Fraud


And More Fraud Is in the Works
July 7, 2014 |
Paul Craig Roberts

Washington can’t stop lying. Don’t be convinced by last Thursday’s job report that it is your fault if you don’t have a job. Those 288,000 jobs and 6.1% unemployment rate are more fiction than reality.

In his analysis of the June Labor Data from the Bureau of Labor Statistics, John Williams (www.ShadowStats.com) wrote that the 288,000 June jobs and 6.1% unemployment rate are “far removed from common experience and underlying reality.” Payrolls were overstated by “massive, hidden shifts in seasonal adjustments,” and the Birth-Death model added the usual phantom jobs.

Williams reports that “the seasonal factors are changed each and every month as part of the concurrent seasonal-adjustment process, which is tantamount to a fraud,” as the changes in the seasonal factors can inflate the jobs number. While the headline numbers always are on a new basis, the prior reporting is not revised so as to be consistent.

The monthly unemployment rates are not comparable, so one doesn’t know whether the official U.3 rate (the headline rate that the financial press reports) went up or down. Moreover, the rate does not count discouraged workers who, unable to find a job, cease looking. To be counted among the U.3 unemployed, the person must have actively looked for work during the four weeks prior to the survey.  


The U.3 rate(the headline rate that the financial press reports)  automatically declines as people who have been unable to find jobs cease trying to find one and thereby cease to be counted as unemployed.

There is a second official measure of unemployment that includes people who have been discouraged for less than one year. That rate, known as U.6, is seldom reported and is double the 6.1% rate.
Since 1994 there has been no official measure than includes discouraged people who have not looked for a job for more than a year.  


Including all discouraged workers produces an unemployment rate that currently stands at 23.1%, almost four times the rate that the financial press reports.

What you can take away from this is the opposite of what the presstitute media would have you believe. The measured rate of unemployment can decline simply because large numbers of the unemployed become discouraged workers, cease looking for work, and cease to be counted in the U.3 and U.6 measures of the unemployment rate.

The decline in the employment-population ratio from 63% prior to the 2008 downturn to 59% today reflects the growth in discouraged workers. Indeed, the ratio has not recovered its previous level during the alleged recovery, an indication that the recovery is an illusion created by the understated measure of inflation that is used to deflate nominal GDP growth.

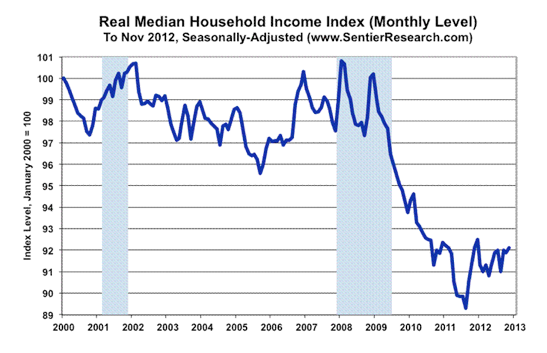
Another indication that there has been no recovery is that Sentier Research’s index of real median household income continued to decline for two years after the alleged recovery began in June 2009. There has been a slight upturn in real median household income since June 2011, but income remains far below the pre-recession level.

The Birth-Death model adds an average of 62,000 jobs to the reported payroll jobs numbers each month. This arbitrary boost to the payroll jobs numbers is in addition to the Bureau of Labor Statistics’ underlying assumption that unreported jobs lost to business failures are matched by unreported new jobs from new business startups, an assumption that does not well fit an economy that fell into recession and is unable to recover.

John Williams concludes that in current BLS reporting, “the aggregate average overstatement of employment change easily exceeds 200,000 jobs per month.”

In other words, the economy did not gain 288,000 new jobs last month. But let’s assume the economy did gain 288,000 jobs and exam where the claimed jobs are reported to be.

Of the alleged 288,000 new jobs, 16,000, or 5.5 percent are in manufacturing, which is not very promising for engineers and blue collar workers. Growth in goods producing jobs has almost disappeared from the US economy. As explained below, to alter this problem the government is going to change definitions in order to artificially inflate manufacturing jobs.

In June private services account for 82 percent of the supposed new jobs. The jobs are found mainly in non-tradable domestic services that pay little and cannot be exported to help to close the large US trade deficit.

Wholesale and retail trade account for 55,300 jobs. Do you believe sales are this strong when retailers are closing stores and when shopping malls are closing?

Insurance contributed 8,500 jobs.

As so few can purchase homes, “real estate rental and leasing” contributed 8,500 jobs.

Professional and business services contributed 67,000 jobs, but 57% of these jobs were in employment services, temporary help services, and services to buildings and dwellings.
That old standby, education and health services, accounted for 33,700 jobs consisting mainly of ambulatory health care services jobs and social assistance jobs of which three-quarters are in child day care services.

The other old standby, waitresses and bartenders, gave us 32,800 jobs, and amusements, gambling, and recreation gave us 3,500 jobs.

Local government, principally education, gave us 22,000 jobs.

So, where are the jobs for university graduates? They are practically non-existent. Think of all the MBAs, but June had only 2,300 jobs for management of companies and enterprises.

Think of the struggle to get into law and medical schools. There’s no job payoff. June had jobs for 1,200 in legal services, which includes receptionists and para-legals. Where are all the law school graduates finding jobs?

Offices of physicians  hired 4,000 people. Outpatient care centers hired 700 people. Nursing care facilities hired 2,400 people. So where are the jobs for the medical school graduates?

Aside from all the exaggerations in the jobs numbers of which ShadowStats.com has informed us, just taking the jobs as reported, what kind of economy do these jobs indicate: a superpower whose pretensions are to exercise hegemony over the world or an economy in which opportunities are disappearing and incomes are falling?

Do you think that this jobs picture would be the same if the government in Washington cared about you instead of the mega-rich?

Some interesting numbers can be calculated from table A.9 in the BLS press release. John Williams advises that the BLS is inconsistent in the methods it uses to tabulate the data in table A.9 and that the data is also afflicted by seasonal adjustment problems. However, as the unemployment rate and payroll jobs are reported regardless of their problems, we can also report the BLS finding that in June 523,000 full-time jobs disappeared and 800,000 part time jobs appeared.

Employers are terminating full-time employment and replacing the jobs with part-time employment in order to come in under the 50-person full time employment that makes employers responsible for fringe benefits such as health care.

Americans are already experiencing difficulties making ends meet, despite the alleged “recovery.” If yet another half million Americans have been forced onto part-time pay with consequent loss of health care and other benefits, consumer demand is further compressed, with the consequence, unless hidden by statistical trickery, of a 2nd quarter negative GDP and thus officially the reappearance of recession.

What will the government do if a recession cannot be hidden? If years of unprecedented money printing and Keynesian fiscal deficits have not brought recovery, what will bring recovery? How far down will US living standards fall for the 99% in order that the 1% can become ever more mega-rich while Washington wastes our diminishing substance exercising hegemony over the world?

Just as Washington lied to you about Saddam Hussein’s weapons of mass destruction, Assad’s use of chemical weapons, Russian invasion of Ukraine, Waco, and any number of false flag or nonexistent attacks such as Tonkin Gulf, Washington lies to you about jobs and economic recovery. Don’t believe the spin that you are unemployed because you are shiftless and prefer government handouts to work. The government does not want you to know that you are unemployed because the corporations offshored American jobs to foreigners and because economic policy only serves the oversized banks and the one percent.

The federal governments Economic Classification Policy Committee has come up with a proposal to redefine fact as fantasy in order to hide offshoring’s contribution to the US trade deficit, artificially inflate the number of US manufacturing jobs, and redefine foreign-made manufactured products as US manufactured products. For example, Apple iPhones made in China and sold in Europe would be reported as a US export of manufactured goods. Read Ben Beachy’s important report on this blatant statistical fraud in CounterPunch’s July 4th weekend edition.

China will not agree that the Apple brand name means that the phones are not Chinese production. If  Obama succeeds with this fraud, the iPhones would be counted twice, once by China and once by the US, and the double-counting would exaggerate world GDP.

For years I have exposed the absurd claim that offshoring is merely the operation of free trade, and I have exposed the incompetent studies by such as Michael Porter at Harvard and Matthew Slaughter at Dartmouth that claimed to prove that the US was benefitting from offshoring its manufacturing. My book published in 2012 in Germany and in 2013 in the US, The Failure of Laissez Faire Capitalism and Economic Dissolution of the West, proves that offshoring has dismantled the ladders of upward mobility that made the US an opportunity society and is responsible for the decline in US economic growth. The lost jobs and decline in the middle class has contributed to the rise in income inequality, the destruction of tax base for cities and states, and loss of population in America’s once great manufacturing centers.

For the most part economists have turned a blind eye. Economists serve the globalists. It pays them well.

The corruption in present-day America is total. Psychologists and anthropologists serve war and torture. Economists serve globalism and US financial hegemony. Physicists and chemists serve the war industries. Physicists and computer geeks serve NSA. The media serves the government and the corporations. The political parties serve the six powerful private interest groups that rule the country.

No one serves truth and liberty. 

Sunday, June 9, 2013

Another Phony Jobs Report

Well, I'm still offline for the foreseeable future, but I had to share this...--jef


From A Government That Lies About Everything
June 7, 2013  | Paul Craig Roberts


June 7, 2013. The payroll jobs report for May released today continues the fantasy.

Goods producing jobs declined, with manufacturing losing another 4,000 jobs, but the New Economy produced 179,000 service jobs.

Are these jobs the high-powered, high-wage “innovation jobs” that economists promised would be our reward from Globalism. I’m afraid not.

According to the Bureau of Labor Statistics, the jobs created are the usual lowly paid
non-exportable domestic service jobs–the jobs of a third world country.

Retail trade accounts for 27,700 of the jobs.

Wholesale trade accounts for 7,900 jobs.

Ambulatory health care services accounts for 15,300 of the jobs.

Waitresses and bartenders account for 38,100 of the jobs.

Local government accounts for 13,000 of the jobs.

Amusements, gambling, and recreation account for 12,500 of the jobs.

Temporary help services provided 25,600 jobs.

Business support services provided 4,300 jobs.

Services to buildings and dwellings provided 6,400 jobs.

Accounting and bookkeeping services provided 3,100 jobs.

Architectural and engineering services provided 4,900 jobs.

Computer systems design and related provided 6,000 jobs (most filled by H-1B work visas).

Management and technical consulting services provided 3,200 jobs.

For a decade this has been the jobs profile of “the world’s most powerful economy.” It is the profile of third world India 40 years ago. The jobs that made the US the dominant economy have been moved off shore by corporations threatened by Wall Street with takeovers if they did not increase their profits.

The easiest way for corporations to increase profits is to take advantage of cheap labor in countries with massive quantities of unemployed labor.

So, if we believe the BLS report, and the reported new jobs are not simply a product of faulty season adjustments and a faulty birth-death model, why is the financial press happy that the US economy can only create third world jobs? Why was the stock market up on the news that the US economy has created 179,000 third world jobs? Would rational markets be up on such discouraging news?

But are the jobs really there?

With retail sales going nowhere, why 35,600 new jobs in wholesale and retail trade?

With real median incomes declining, why 38,100 more waitresses and bartenders? For every month as long as I can remember the BLS reports numerous new jobs in waitresses and bartenders, despite the long-term decline in real median income.

In the May jobs report, where are the jobs for the vast number of new college graduates?

The US now has more hotel maids, bartenders, and waitresses than it has manufacturing workers. The US has twice as many people employed in government than in manufacturing.
The services of maids, bartenders, waitresses, and government cannot be exported.
Therefore, the US trade deficit remains large and without exports to reduce it, a crisis in itself.

What the BLS jobs reports have been telling us for many years is that the US economy is in crisis, in a death-spiral. Yet, not a handful of economists’ voices have been raised.

Today president obama’s economist said that the notch upward in the unemployment rate was because the economic outlook was so good that more people were encouraged to enter the labor market than there were new jobs available.

The conclusion is inescapable: The same government that lies about weapons of mass destruction, Saddam Hussein’s al-Qaeda connections, Iranian nukes, and so on, also lies about jobs, the unemployment rate, the inflation rate, rigs every financial and commodity market, pretends that terrorism is such a threat that the US Constitution must be set aside and that Americans are safer without the protection of habeas corpus and due process.

It is amazing how rare terrorism is
, especially with Washington in the second decade of trying to stir up terrorism by invading countries on totally false pretenses, murdering citizens of countries, such as Pakistan and Yemen with drones, and supporting Israel’s never-ending murder and dispossession of the Palestinians.

After such massive provocations from Washington, one would think that the world would be ablaze with terrorism. But it isn’t.

As there is so little terrorism, Washington and its presstitute media call those who resist
Washington’s invasion of their countries “terrorists.” Everyone who resists Washington’s military aggression is a terrorist. Just ask the New York Times, Fox News, or any neoconservative. Or, for that matter, the Bilderbergs, the Council on Foreign Relations, the Trilateral Commission, and Homeland Security, the Gestapo organization that now defines all American dissenters to be “domestic extremists.”

Washington’s claim that Americans have “freedom and democracy” is the sickest joke in human history.

In 21st century America, defendants have no more rights than the accused in Nazi Germany or Stalinist Russia. The FBI now shoots suspects brought in for questioning in the back of the head even before the suspect is arrested.

Long before Bradley Manning’s trial the presstitutes have convicted the accused based on lies leaked by the prosecutors. Consider Bradley Manning. After three years of detention, including one year of torture, he is brought to a rigged trial as a national security danger. All that Bradley Manning did was to comply with the Military Code and report war crimes. As his corrupt superiors did not want to know, he complied with his duty, apparently, by going public.

Now he is being made an example. The message is clear: Support Washington’s war crimes or be destroyed.

The Amerika that exists today has more in common with Nazi Germany than with the America in which I grew up. The young don’t know any different. But those my age realize that we have lost our country. America no longer exists.

Monday, March 11, 2013

The Chart That Proves The Flaw in How the BLS Figures the Unemployment Rate

March 10th, 2013
InvestmentWatch


The mainstream media is absolutely giddy that the U.S. unemployment rate (U3) has hit a “four-year low” of 7.7 percent. But is unemployment in the United States actually going down? After all, you would think that it should be. The Obama administration has “borrowed” more than 6 trillion dollars from future generations of Americans, interest rates have been pushed to all-time lows, and the Federal Reserve has been wildly printing more money in a desperate attempt to “stimulate” the economy. So have those efforts been successful? Well, according to the mainstream media, the U.S. unemployment rate is falling steadily. Headlines all over the nation boldly declared that “236,000 jobs” were added to the economy in February, but what they didn’t tell you was that the number of Americans “not in the labor force” rose by 296,000.

That is how they are getting the unemployment rate to go down – by pretending that huge numbers of unemployed Americans don’t want jobs. Sadly, as you will see below, the truth is that the percentage of working age Americans that have a job is just 0.1% higher than it was exactly three years ago. And we have not even come close to getting back to where we were before the last economic crisis.

At this point, the “unemployment rate” has become so meaningless that it really isn’t even worth paying much attention to. If you really want to know what the employment picture looks like in the United States, you need to look at the employment-population ratio.

As Wikipedia tells us, many economists consider the employment-population ratio to be far superior to other measurements of employment…
The Organization for Economic Co-operation and Development defines the employment rate as the employment-to-population ratio. The employment-population ratio is many American economist’s favorite gauge of the American jobs picture. According to Paul Ashworth, chief North American economist for Capital Economics, “The employment population ratio is the best measure of labor market conditions.” This is a statistical ratio that measures the proportion of the country’s working-age population (ages 15 to 64 in most OECD countries) that is employed. This includes people that have stopped looking for work.
A chart of the employment-population ratio in the United States over the past several years is posted below…
Employment-Population Ratio 2013


As you can see, the percentage of Americans with a job fell from about 63 percent to below 59 percent during the last economic crisis.  Since that time, it has not risen back above 59 percent.  This is the first time in the post-World War II era that we have not seen the employment rate bounce back following a recession.  At this point, the employment-population ratio has been below 59 percent for 42 months in a row.

Yes, we should be thankful that things have stabilized, but as you can see there has been no recovery.  The percentage of Americans with a job is essentially exactly where it was three years ago.  Despite the trillions of dollars that the U.S. government has borrowed, and despite the reckless money printing that the Federal Reserve has been doing, the employment situation in the U.S. has not turned around.

Data for the employment-population ratio from the beginning of 2008 is posted below…


2008-01-01 62.9
2008-02-01 62.8
2008-03-01 62.7
2008-04-01 62.7
2008-05-01 62.5
2008-06-01 62.4
2008-07-01 62.2
2008-08-01 62.0
2008-09-01 61.9
2008-10-01 61.7
2008-11-01 61.4
2008-12-01 61.0
2009-01-01 60.6
2009-02-01 60.3
2009-03-01 59.9
2009-04-01 59.8
2009-05-01 59.6
2009-06-01 59.4
2009-07-01 59.3
2009-08-01 59.1
2009-09-01 58.7
2009-10-01 58.5
2009-11-01 58.6
2009-12-01 58.3
2010-01-01 58.5
2010-02-01 58.5
2010-03-01 58.5
2010-04-01 58.7
2010-05-01 58.6
2010-06-01 58.5
2010-07-01 58.5
2010-08-01 58.5
2010-09-01 58.5
2010-10-01 58.3
2010-11-01 58.2
2010-12-01 58.3
2011-01-01 58.3
2011-02-01 58.4
2011-03-01 58.4
2011-04-01 58.4
2011-05-01 58.4
2011-06-01 58.2
2011-07-01 58.2
2011-08-01 58.3
2011-09-01 58.4
2011-10-01 58.4
2011-11-01 58.5
2011-12-01 58.6
2012-01-01 58.5
2012-02-01 58.6
2012-03-01 58.5
2012-04-01 58.5
2012-05-01 58.6
2012-06-01 58.6
2012-07-01 58.5
2012-08-01 58.4
2012-09-01 58.7
2012-10-01 58.7
2012-11-01 58.7
2012-12-01 58.6
2013-01-01 58.6
2013-02-01 58.6


So is there anyone out there that still wants to insist that the employment picture in the United States is getting significantly better?

Anyone that wants to claim that “unemployment is going down” should at least wait until the unemployment-population ratio gets back up to 59 percent. Otherwise they just look foolish.

Yes, the Dow is at an all-time high right now. But a bubble is always the biggest right before it bursts.

Most Americans understand that the Dow has been pumped up with all of the funny money that the Fed has been printing. Most Americans understand that the stock market really does not accurately reflect the health of the U.S. economy as a whole.

Just consider these numbers…
  • The number of Americans on food stamps has risen from 32 million to 47 million while Barack Obama has been in the White House.
  • According to the U.S. Census Bureau, more than 146 million Americans are either “poor” or “low income” at this point.
  • Median household income in the United States has fallen for four consecutive years.
  • The number of homeless people sleeping in homeless shelters in New York City has increased by 19 percent over the past year.

No, the truth is that everything is most definitely not fine.

If everything is fine, then why did the Federal Reserve inject another 100 billion dollars into foreign banks during the last full week of February?

The U.S. government and the Federal Reserve are desperately trying to prop up the entire global economy. Unfortunately, the global financial system has been built on a foundation of sand and the tide is coming in.

Back in 2008, a derivatives crisis was one of the primary causes of the worst financial panic since the Great Depression.

So did we learn our lesson?

No, the boys on Wall Street are back at it again as a recent article by Jim Armitage described…
Historically, stock markets, being driven by humans, have tended to have a similar length memory of catastrophes, before making the same dumb mistakes again.

But it hasn’t even been five years since derivatives (on that occasion based on daft mortgages) blew up the world, and yet these exotic creatures have already returned. With a vengeance.

Research from Thomson Reuters declared that banks were creating more derivatives known as asset-backed securities than at any time since before the Lehman Brothers crash. Of those, 22 percent were made up of – and forgive me the alphabet soup here – CDOs and CLOs. The very type of derivatives that exploded last time. At this stage last year, only 6 percent fell into those categories.

In other words, banks are creating more of the riskiest types of the riskiest products.

At some point, we will have another derivatives crisis even worse than the last one.

When that happens, financial markets all over the globe will crash, economic activity will grind to a standstill and unemployment will go skyrocketing once again.

But as you saw above, we have never even come close to recovering from the last crisis.

So you can believe the mind-numbing propaganda that the mainstream media is trying to feed you if you want. Unfortunately, the reality of the matter is that we have not recovered from the last major economic crisis, and another one is rapidly approaching.

Staring Armageddon In The Face But Hiding It With Official Lies

March 10, 2013 | Paul Craig Roberts

According to the Bureau of Labor Statistics, the US economy created 236,000 new jobs in February. If you believe that, I have a bridge in Brooklyn that I’ll let you have at a good price.

Where are these alleged jobs? The BLS says 48,000 were created in construction. That is possible, considering that revenue-starved real estate developers are misreading the housing situation. t

Then there are 23,700 new jobs in retail trade, which is hard to believe considering the absence of consumer income growth and the empty parking lots at shopping malls.

The real puzzle is 20,800 jobs in motion picture and sound recording industries. This is the first time in the years that I have been following the jobs reports that there has been enough employment for me to even notice this category.

The BLS lists 10,900 jobs in accounting and bookkeeping, which, as it is approaching income tax time, is probably correct; 21,000 jobs in temporary help and business support services; 39,000 jobs in health care and social assistance; and 18,800 jobs in the old standby–waitresses and bartenders.

That leaves about 50,000 jobs sprinkled around the various categories, but not in numbers large enough to notice.

The presstitute media attributed the drop in the headline unemployment rate (U3) to 7.7% from 7.9% to the happy jobs report. But Rex Nutting at Market Watch says that the unemployment rate fell because 130,000 unemployed people who have been unable to find a job and became discouraged were dropped out of the U3 measure of unemployment. The official U6 measure which counts some discouraged workers shows an unemployment rate of 14.3%. Statistician John Williams’ measure, which counts all discourage workers (people who have ceased looking for a job), is 23%.

In other words, the real rate of unemployment is 2 to 3 times the reported rate.

Nutting believes that the U3 unemployment rate has become too politicized to have any meaning. He suggests using instead the work force participation rate. This rate is falling substantially, reflecting the discouragement that occurs from inability to find jobs.

John Williams (shadowstats.com) says that distortions in seasonal factor adjustments overstate monthly payroll employment by about 100,000 jobs. The jobs data that is not seasonally adjusted shows about 1.5 million fewer jobs in the economy.

In a recent communication, statistician John Williams (shadowstats.com) reports that the rigged official annual rate of consumer inflation (CPI) of 1.6% is in fact, as measured by the official US government methodology of 1990, 9.2%. In other words, the rate of inflation is 5.75 times greater than the reported rate. If Williams is correct, the interest rate on bonds is extremely negative.

Over the years the official measure of inflation has been altered in two ways. One is the introduction of substitution for what formerly was a constant weighted basket of goods. In the former measure, if a price of an item in the basket (index) rose, the CPI rose by the weight of that item in the basket.

In the substitution-based measure, if a price of an item in the basket goes up, the item is removed from the basket, and a cheaper item is put in its place. For example, if the price of New York strip steak rises, the new CPI will substitute the price of a cheaper cut.

In this new measure, inflation is held down by measuring not a fixed standard of living but a declining standard of living.

The other adjustment used to restrain the measure of inflation is to re-classify many price rises as “quality improvements.” Price rises declared to be quality improvements do not translate into a higher measure of inflation. In other words, if a product rises in price, the price increase or some portion of it can be assigned to improved quality, not to a rise in component or energy costs. As the incentive is to hold down the inflation measure in order to save money for the government on Social Security cost-of-living-adjustments, quality improvements are over-estimated.

Consumers have to pay the higher prices, and as incomes, except for the 1 percent, are not growing, higher product prices, regardless of whether they are or are not quality improvements, mean a lower standard of living for the 99 percent.

The understated new measure of inflation allows the government to show real GDP growth and thus the end of the December 2007 recession, and it allows the government to show in the latest report real retail sales again matching the pre-recession level. However, when measured correctly, as by statistician John Williams, the true picture of retail sales shows a steep decline from 2007 through 2009 and bottom bouncing since.

The reason real retail sales cannot recover is that real average weekly earnings continues its downward path. Earlier in this new century, the lack of income growth for the bulk of the US population was masked by a rise in consumer debt. Americans borrowed to spend, and this kept the economy going until the point was reached that consumers had more debt than they could service.

John Williams report of real average weekly earnings shows that Americans are taking home less purchasing power than they did in the 1960s and 1970s.

Reflecting the dollar’s loss of purchasing power, the price of gold and silver in dollars has risen dramatically during the Bush and Obama regimes.

For the last year or two the Federal Reserve and its dependent banks have operated to cap the price of gold at around $1,750. They do this by selling naked shorts in the paper speculative gold market.

There are two gold markets. One is a market for physical possession by individuals and central banks. The rising demand in the physical bullion market points to a rising price for gold.

The other market is the speculative paper market in which financial institutions bet on the future gold price. By placing large amounts of shorts, this market can be used to suppress price rises in the physical market. The Federal Reserve, which can print money without limit, can cover any losses on its agents’ paper contracts.

It is important to the Federal Reserve’s low interest rate policy to suppress the bullion price. If the prices of gold and silver continue to rise relative to the US dollar, the Fed cannot keep the prices of bonds high and interest rates low. If the dollar is widely perceived to be declining in value in relation to gold, the price of dollar-denominated assets will also decline, including bonds. If the dollar loses value, the Fed loses control over interest rates, and the US financial bubble pops, with hell to pay.

To forestall armageddon, the Fed and its dependent banks cap the price of gold.

The Fed’s fix is temporary, and as the Fed continues to create ever more dollars, the price of gold will eventually escape the Fed’s control as will interest rates and inflation.

The Fed has produced a perfect storm that could consume the US and perhaps the entire Western world.

Wednesday, February 27, 2013

A Quest for New Jobs Where None Exist

Obama Moves Fast - on The Road to the Past
by JOHN WALSH
“Those jobs are not coming back.” The late Steve Jobs to Barack Obama.

Hot on the heels of his State of the Union address with its emphasis on the moribund job market, Obama hit the road in search of jobs – but it was a road to a dying land. Pitching the idea of reviving jobs by revving up the manufacturing sector as the “number one priority,” Obama trekked about from Ohio to Alabama in a quest to find some factories with signs of life in them.

But Obama’s strategy is an absurdity, more fitting for the 19th Century than the 21st. Had he embarked on a tour of farms, calling for more jobs in agriculture, a “return to the land,” he would be considered a lunatic. And for good reason. Agriculture is a very small portion of the economy and everyone knows it. But the same is true of manufacturing. Look at this table from the U.S. Census of 2010.

Only 0.7% of the work force is employed in farming, fishing and agriculture. The total number of Americans employed in “production” (aka manufacturing) is about 8 million or only about 6% of the entire workforce (1). While not quite as marginal as agriculture, manufacturing comes close. Hold on, you may say, the low percentage of workers in production in 2010 is due to the Great Recession. No it is not. If you examine similar data from the 2000 census, the total percentage employed in production was only 9%. And 2000 was a year of prosperity before the recession of 2001 and before China joined the WTO and allegedly began to eat our export lunch, a ludicrous charge if carefully examined.

U.S. unemployment hovers around 8%. At least that is the “headline unemployment,” or technically the “U.3” calculation according to the Bureau of Labor Statistics (BLS). But the BLS calculates a much higher number, “U.6” which is about 15%, about twice as high as the “headline” unemployment figure found in the main stream media(2). Manufacturing, even in 2000 employed only 9% of the workforce and its decline in Great Recession accounts for loss of jobs for only by 3% of the workforce. How is such a sector supposed to employ an additional 8-15% of the workforce.? Obama’s call for a “return to the factories” is nearly as ludicrous as a call to “return to the land.” In a modern, developed economy manufacturing is a small percentage of the total. And that is as it should be. Moreover even as the number of jobs in manufacturing has fallen over the last 13 years, manufacturing output is increasing exponentially as can easily be seen by a glance at the second of the two graphs here. (Please dear reader, take a a moment to peruse this graph since it tells us that the decline in manufacturing jobs over the last decade is due in large part to automation – as opposed to offshoring alone.) We are increasingly being freed from that labor which is being taken over by automata. We should welcome that just as we welcomed the mechanization of agriculture.

Right now China and the U.S. each account for about 20% of the world’s manufacturing output, but that requires about 40% of China’s economy and only about 10% of ours. And for the U.S., with 4% of the world’s population, to put out 20% of world manufacturing is not bad at all. The U.S. already has far more than its “share” of world manufacturing. According to a careful study by the Federal Reserve of San Francisco, 88.5% of all U.S. consumer spending is on goods and services made in America. (Only 2.7% is made in China.) And considering only durable goods (i.e., manufactured goods), 67% are made in the U.S. and only 12% are made in China. This is quite the opposite of the views held by most Americans, stubborn myths badly in need of correction.

Steve Jobs warned Obama that “those jobs are not coming back.” Jobs, a man of some precision, chose his words carefully. He did not say that manufacturing was not going to return to the U.S. from its overseas locations. It may and in fact it will, depending on the advantages of producing close to the American market and the wage levels of U.S. workers. Of course the return of manufacturing jobs because of lower wages in America is not something to be desired – at least not if you are a working stiff. The U.S. minimum wage is now $7.25 per hour. The most sophisticated production robots work at a cost of somewhat less than $4 an hour. Robots work more cheaply. Inescapably, manufacturing will return only in an ever more highly automated form with ever fewer jobs.

This same dynamic is taking hold around the world. Look at the much discussed Taiwanese manufacturing firm Foxconn which turns out Apple products in China. Labor is in short supply in China, and hence the workforce is demanding – and getting – higher wages. (Given this fact it is quite amazing to hear “progressives” use the term “slave labor” with respect to China.) FoxConn is alarmed, and it has been moving rapidly to ever higher levels of automation. A few years ago it had no robots. Now it has thousands and in a few years Foxconn plans to have one million robots! The trajectory is the same as in the U.S.

As Mark J. Perry of the University of Michigan at Flint documents relentlessly and repeatedly, the share of manufacturing in the economy is going down worldwide – even as manufacturing output continues to grow exponentially. Ever more is being done with ever less human labor. In the developed countries the industrial proletariat is rapidly disappearing. And it is only a matter of time before the same thing happens across the globe.

These same forces for automation are exerting themselves in every sector of society. How many human personnel have you seen taking payments on toll roads recently? How many human voices have you spoken to when you call a large corporation on the phone? At the Mayo Clinic, robots have replaced humans in carrying drugs from pharmacy to bedside. And they are sufficiently sophisticated that they do not bump into anyone along the way!

So what are we to do? The answer lies in acknowledging that we long ago left the age of scarcity in the developed world. That was made clear a century and a half ago by the old boys in their classic work, The German Ideology. And the developing world is not far behind.

The soundest answer right now is to begin a struggle for a shorter work week with no cut in pay – 32 hours work for 40 hours pay. For a work force of 139 million as in 2010, that translates into 34.8 million additional jobs, i.e., 25% more jobs.
A shorter work week decreases the hours of labor available to employers and exerts an upward pressure on wages. In turn that helps to redistribute income in favor of those now sharing less in the abundance that a developed society creates. Let the marketplace act in the favor of the working class. Tactically such a program can be implemented at various levels. First the shorter work week can be the subject of bargaining between employer and employee at the level of the individual enterprise, with supporting strikes and boycotts. For that no legislation is needed which should be pleasing to those who claim to be interested in less government intrusion. Second, the struggle can be waged at the level of state legislatures and Congress. Here the ballot box can be used to reward legislative allies and punish foes.

Finally a look around will tell you that Americans are harassed, with little time for themselves and their loved ones. And more leisure time is badly needed for an overworked and overstressed population with little time for exercise and relaxation so critical to good health and a good life. The cry of “back to the factories” is a call to return to the past, a far less productive and prosperous past at that.

  1. The Bureau of Labor Statistics (BLS) provides different numbers for “manufacturing” than does the Census for “production.” Thus in 2010 according to the BLS, the number employed in “manufacturing” constituted about 8% as opposed to 6% of the labor force as calculated from the Census data above. It seems worthwhile to use Census figures when possible since they are more direct and therefore less controversial. But a difference between 8% and 6% does nothing to alter the essential point being made. Manufacturing is a declining source of employment in a modern, developed economy. And that will not change.
  2. According to the careful work of ShadowStats, the unemployment rate is in the range of 23% and growing.

Tuesday, January 8, 2013

Washington’s Hegemonic Ambitions Are Not in Sync With Its Faltering Economy

January 7, 2013 | Paul Craig Roberts

In November the largest chunk of new jobs came from retail and wholesale trade. Businesses gearing up for Christmas sales added 65,700 jobs or 45% of November’s 146,000 jobs gain. With December sales a disappointment, these jobs are likely to reverse when the January payroll jobs report comes out in February. Family Dollar Stores CEO Howard Levine told analysts that his company’s customers were unable to afford toys this holiday season and focused instead on basic needs such as food. Levine said that his customers “clearly don’t have as much for discretionary purchases as they once did.”

For December’s new jobs we return to the old standbys: health care and social assistance and waitresses and bartenders. These four classifications accounted for 93,000 of December’s new jobs, 60% of the 155,000 jobs.

Obviously, the economy is not going anywhere except down.

It takes approximately 150,000 new jobs each month to stay even with population growth and new entrants into the work force.  

Few of the jobs that are being created pay well, and the constant, consistent demand for more poorly paid waitresses, bartenders and hospital orderlies is difficult to believe. If Americans cannot afford toys for their kid’s Christmas, how can they afford to eat and drink out?

Media spin seeks to create a recovery out of thin air, but these graphs from John Williams (shadowstats.com) show the reality:


Keep in mind that the 7.8% unemployment rate (U.3) that is headlined by the financial media does not include discouraged workers who have ceased to look for jobs. The government’s U.6 rate includes workers who have been too discouraged to seek work for less than a year. This rate of unemployment is 14.4%, almost twice the U.3 rate that the media prefers to report.

In 1994 the US government defined out of existence unemployed Americans who have been discouraged from finding work for more than a year. John Williams estimates the long term discouraged workers. When his estimate is added to the U.6 measure, the US unemployment rate stands at 23%, three times the reported rate.

The rate of unemployment is so high because millions of US jobs have been offshored and given to Chinese, Indian, and other workers and because remaining businesses have been concentrated in few hands in violation of the anti-trust laws. (Go to this URL to see the concentration of the media: http://frugaldad.com/2011/11/22/media-consolidation-infographic/ )

We need to be concerned about a financial media and economics profession that believes a recovery is underway when the unemployment rate is so high and the real median income is so low. It is a mystery how any set of policymakers could possibly have believed that a country whose economy is driven by consumer expenditures can continue to expand when the jobs that produce the incomes that drive the economy are given to foreigners in foreign lands.

Essentially, Americans were told a packet of lies designed to win their gullible acceptance to an economy that produces high returns for Wall Street, shareholders, and corporate executives at the expense of everyone else in the country. The wage savings from the use of overseas labor means large rewards for the one percent and Family Dollar customers who cannot afford to buy toys for their children at Christmas.

Saturday, December 15, 2012

More Phony Employment Numbers

The fact that the U3 is the official unemployment figure used by the govt and press is bad enough since it's not even the most accurate number on Table A15 (where the figures are presented, see the U6 rate for a more accurate, yet still incomplete rate), but it's how they are able to consider so many people as "having stopped looking because they are discouraged" and don't count them as unemployed even though they need a job as badly as people who haven't stopped looking. I know people unemployed 4 yrs with no hope, yet they still look.--jef


December 8, 2012 |  paul craig roberts


Statistician John Williams (shadowstats.com) calls the government’s latest jobs and unemployment reports “nonsense numbers.”

There are a number of ongoing problems with the released numbers. For example, the concurrent-seasonal factor adjustments are unstable. The birth-death model adds non-existent jobs each month that are then taken out in the annual downward benchmark revisions. Williams calculates that the job overstatement through November averages 45,000 monthly. In other words, employment gains during 2012 have been overstated by about 500,000 jobs. Another problem is that each month’s jobs number is boosted by downside revision of the previous month’s jobs number. Williams reports that the 146,000 new jobs reported for November “was after a significant downside revision to October’s reporting. Net of prior-period revisions, November’s seasonally-adjusted monthly gain was 97,000.”
Even if we believe the government that 146,000 new jobs materialized during November, that is the amount necessary to stay even with population growth and therefore could not be responsible for reducing the unemployment rate from 7.9% to 7.7%. The reduction is due to how the unemployed are counted.

The 7.7% rate is known as the “headline rate.” It is the rate you hear in the news. Its official designation is U.3.

The Bureau of Labor Statistics has another official unemployment rate known as U.6.

The difference is that U.3 does not include discouraged workers who are not currently actively seeking a job. (A discouraged worker is a person who has given up looking for a job because there are no jobs to be found.) The U.6 measure includes workers who have been discouraged for less than one year. The U.6 rate of unemployment is 14.4%, about double the headline rate.
The U.6 rate does not include long-term discouraged workers, those who have been discouraged for more than one year. John Williams estimates this rate and reports the actual rate of unemployment (known as SGS) in November to be 22.9%.


In other words, the headline rate of unemployment is one-third the actual rate.
The drop in the November headline rate of unemployment from 7.9 to 7.7 is due to a 20.4% increase in the number of short-term discouraged workers in November. In other words, unemployed people rolled out of the U.3 measure into the U.6 measure.

Similarly, a number of short-term discouraged workers roll out of the U.6 measure into John Williams’ measure that includes all of the unemployed. Williams reports that “with the continual rollover, the flow of headline workers continues into the short-term discouraged workers (U.6), and from U.6 into long term discouraged worker status (a ShadowStats.com measure), at what has been an accelerating pace. The aggregate November data show an increasing rate of individuals dropping out of the headline (U.3) labor force.” In other words, the headline rate of unemployment can drop even though the unemployed are having a harder time finding jobs.

The U.S. government simply lowers the unemployment rate by not counting all of the unemployed. We owe this innovation to the Clinton administration. In 1994 the Clinton administration redefined “discouraged workers” and limited this group to those who are discouraged for less than one year. Those discouraged for more than one year are no longer considered to be in the labor force and ceased to be counted as unemployed.

If the U.S. government will mislead the public about unemployment, it will also mislead about Syria, Iran, Iraq, Afghanistan, Libya, Somalia, Pakistan, Yemen, Lebanon, Palestine, Russia, China, and 9/11. The government fits its story to its agenda.

A government that wants to cut the social safety net doesn’t want you to know that the unemployment rate is 22.9%. A government that wants to cut the social safety net when between one-fifth and one-fourth of the work force is out of work looks hard-hearted, mean-spirited, and foolish. But if the government reports only one-third of the unemployed and presents that rate as falling, then the government can present its cuts as prudent to avoid falling over a “fiscal cliff.”

If the “free and democratic” Americans cannot even find out what the unemployment rate is, how do they expect to find out about anything?

Monday, October 15, 2012

Trump calls jobs report phoney: says Unemployment is really ’21 percent’

God, I hate siding with these idiots, but on this one point, they are correct. It's the math formula they use, it's not anything corrupt, and it's certainly not a conspiracy on the BLS' part to fudge the numbers to make the president look good. It's the way they discount "discouraged workers". You are considered a "discouraged worker" if you haven't interviewed in a month (which the BLS calls"actively seeking employment--when anybody still looking for work can tell you that often times you'll go for a month without an interview). You can be working your butt off looking for work, but without seeing anybody or receiving any benefits, you aren't considered unemployed

There is a category for marginally attached to the workforce, and that rate is 14.7%. When you factor in the "discouraged unemployed" (those who are considered discouraged even though they continue to look, AND those who are genuinely discouraged), those who once had a professional career but who now work part-time for minimum wage (underemployed), and people who were forced to take early retirement rather than a layoff, then the idiot Trump is correct:  the real unemployment rate is about 21%.

Here is the Bureau of Labor and Statistics Table A15:.


The U3 total on the far right is the household survey that excludes practically everyone--the marginally attached, the under employed, early retirees---at 7.8%, it's the media number they use every month when they report unemployment: THE figure----but as you can see just below that figure, there are higher numbers. What are they for? They are more accurate (yet still incomplete) rates of unemployment based on data you can see at the linked PDF below.(Click on the chart to take you directly to the Table A15 page so you can be sure I haven't photoshopped the graph to make my point) You can see the U6 is at 14.7%--double the U3. And like I said, that's a much more accurate rate of unemployment but even it's not complete.

It's also interesting that the U3 went down, but the U6 stayed the same.

Here is a PDF put out by the BLS explaining how the data is compiled. Please download it and see for yourself.

Trust me, ever since I learned there were several different rates of unemployment, I've been obsessed with letting people know that unemployment is ALWAYS worse that the figure reported on the news. The proof is in the BLS's own information. They started using this formula in 1994, so these aren't comparable numbers to the great depression since the formula are different.

Keep in mind, based on the BLS birth/death rate model, we have to create 150,000 new jobs each month (some say 200K, others say 100K, so I go for the mean, which is what most economists do too) just to keep up with the number of new employees entering the job market each and every month. So, the total number of jobs created each month have to total more than 150K, or else it's a net jobs loss for the month. Is that clear? Any total less than 150K, means not enough jobs were created to keep up with the new employees entering the market, much less the increasing number of long-term unemployed, recently unemployed, and under employed seeking better jobs. To significantly lower unemployment, they would have to create more than 200,000 jobs every month, and the effects in the job market would not improve in a month. It would take at least a quarter for the results to show.

So, on just this one issue, the Republicans are correct, except that no one is pointing out the difference in the U3 to the U6 and so forth. I haven't heard ANYONE talking about the schedule at all. SO Republicans think the Democrats are fudging the numbers, and the Democrats call the Republicans conspiracy theorists, when they are both whacked because they don't understand how they compute the figures when it's all right there on the site.

Understand, Donald Trump is a DOUCHEBAG MORON. But obviously, he has someone on his staff who understands how they compute the numbers, but is withholding the fact that it's how they've been doing it since Clinton was president--both Republicans and Democrats. Though, prior to 1994, the U3 was NOT the unemployment rate used when reporting to the media and the public. It was a rate that was used in the larger formula to compute an overall unemployment rate, rather than the U3 BEING the overall unemployment rate, which as you can clearly see, it's not the overall unemployment rate. It's the "keep us complacent" number. Because if we started looking at the U6 instead of the U3, people would freak out.

Here is a chart that computes the data the way they did prior to 1994. You see the U3 schedule represented along with the U6. The 3rd rate is what actual unemployment is, and as you can see, it's about 21%--which is higher than all but 3 years during the great depression.


####


Trump calls jobs report phoney: says Unemployment is really ’21 percent’
By David Edwards
Monday, October 15, 2012 
Adding one more conspiracy theory to his resume on Monday, Donald Trump suggested that President Barack Obama’s team had concocted a “phony” 7.8 percent unemployment number and that the real unemployment rate could be as high as 21 percent. (He's correct about the rate, not that the data was concocted or phony; at worst, it's just incomplete--if Trump weren't such an idiot, he could point to Table A15--jef)

Earlier this month Former, GE CEO Jack Welch spawned a “jobs truthers” front after he tweeted that an unemployment rate of 7.8 percent was “unbelievable,” and added that the “Chicago guys” in Obama’s campaign headquarters “will do anything..can’t debate so change numbers.”

Trump told the hosts of Fox & Friends on Monday that Welch got it right.

“They’re not real numbers because the 7.8 [percent] — as Jack Welch said and he took a lot of heat for saying it, but he’s right — I guarantee you’re going to have a correction right after the election,” the billionaire reality star explained. “The 7.8 is not a real number. The real number is 15 percent (the U6--jef), 16 percent, people even say 21 percent.(the SGS stats above--jef)

“So, it’s a phony number,” he added. “I don’t know how they allow it to get out there, but I guarantee you, as you’re sitting there after the election, that number is going to be corrected substantially upward. And everybody knows it.” (It's not phony, it's incomplete.--jef)

Trump also had some advice for Republican presidential nominee Mitt Romney prior to Tuesday night’s second debate with Obama.

“I don’t think he has to prepare too much,” Trump explained. “He’s a smart guy. He’s a good leader. He has it. He gets it for this country. He really gets it. And I will say this, if Obama has a performance like he had a couple of weeks ago, I don’t believe it’s possible for him to win the election.”

“Who knows? Did he become more intelligent in the last two weeks? You tell me.”

###

So, see, this whole issue is easily put to rest by some simple fact checking that no one seems to be aware of. Romney is going to say whatever he can to get elected. Obama shouldn't even have to worry about the election, except that he hasn't done a very good job at all, especially for working class people, which is the ONLY reason Romney isn't double digits behind Obama.

Saturday, September 8, 2012

Spinning Bad Financial News Into Good

September 8, 2012 | ~ Paul Craig Roberts

Friday’s payroll jobs report says that 96,000 new jobs were created in August and that the unemployment rate (U.3) fell from 8.3% to 8.1%. As 96,000 new jobs are not enough to keep up with population growth (150,000 jobs per month), the decline in the U.3 unemployment rate was caused by 368,000 discouraged job seekers giving up on finding employment and dropping out of the work force as measured by U.3.

Discouraged workers are not included in the U.3 measure of unemployment, which makes the measure useless. The only purpose of U.3 is to keep bad news out of the news. the U.3 unemployment rate only measures those who have not been discouraged by the inability to find a job and are still actively seeking employment.

The government produces another unemployment measure, U.6, which includes people who have been discouraged by the inability to find a job and have been out of the work force for less than a year. This measure of unemployment is 14.7%, a number that would get attention if reported.

When the long-term (more than one year) discouraged workers are included, the US unemployment rate is about 22%. In other words, the real US rate of unemployment is almost three times higher than the reported headline rate of 8.1%, about 23%.

What is the purpose of reporting an unemployment rate that is about one-third the real unemployment rate? The only answer is deception through Happy News.

Let’s have a look at those 96,000 jobs. What kind of high-tech, high-income super jobs is “the world’s only superpower, the indispensable nation, the world’s greatest economy and capitalist heaven” creating? The answer is lowly paid third world jobs, which is why there is not and cannot be an economic recovery. All the good jobs have been moved offshore in order to maximize the incomes of the rich.

According to the US Bureau of Labor Statistics (BLS), 28,300 of the 96,000 jobs or 29% are waitresses and bartenders. http://www.bls.gov/news.release/empsit.t17.htm

Health care and social services, primarily ambulatory health care services and home health care services, provided 21,700 jobs or 22.6% of the jobs.

So, 52% of the new jobs created by the American superpower are lowly paid waitresses, bartenders, practical nurses, and hospital orderlies.

Highly paid manufacturing jobs declined by 15,000. The incomes lost by these jobs most likely exceed the income gains from the waitresses, bartenders, and hospital orderlies jobs.

Where did the other 46,000 jobs come from?

Formerly, in hard times government employment would expand, but, despite Republican propaganda, not today in today’s mean times. Government (federal, state and local) lost 7,000 jobs.

Professional and business services gained 28,000 jobs, primarily in computer systems design and related services (mainly Indians on H-1B work visas) and management and technical consulting services (mainly former corporate professional employees who now eke out a living by consulting, without pension or health benefits, with their former employers; in other words, they are working the same for less).

These three categories account for 81% of the new jobs.

Where are the remainder?

A few thousand jobs in finance and insurance, jobs that absorb consumer incomes but produce no product. Telephone, cable, water, electricity, and heating produced 8,800 jobs. Transportation and warehousing to store unsold goods produced 5,700 jobs. Retail trade, primarily food and beverage stores (alcohol), produced 6,100 jobs.

And there you have it. The “powerful American economy” is an economy that cannot produce its own clothes and shoes, or the manufactured products, including high technology products, that it consumes, or its own energy, all of which it imports by issuing more debt.

The “great hegemonic American economy” is on the verge of total collapse, because the only way it can pay for the imports that sustain it is by issuing more debt and printing more money. Once the debt and money creation undermine the dollar as world reserve currency, the US will become overnight a third world country, much to the relief of the rest of the world.

Last week Mr. Draghi, the head of the European Central Bank, announced for propaganda purposes that the ECB would buy up the sovereign debt of the troubled EU member governments if, and only if, the assisted member governments agreed to the conditionality that would be imposed.

In other words, Draghi told Greece, Spain, and italy that the ECB will buy your bonds if you do what we tell you. Draghi’s conditions are a combination of austerity on the countries’ populations and the surrender of the countries’ financial sovereignty. Since the troubled debtor countries already had that option, Draghi’s scheme doesn’t change anything. However, the NY StockExchange used Draghi’s announcement to gin up day-trading profits.

Draghi says that the money that the ECB will pour into purchasing Greek, Italian and Spanish bonds will be offset by draining reserves from the European banking system, hardly a helpful operation to stressed banks and European recession.

It is difficult to image worse news than Draghi’s. Yet, stock markets rose. This result is more evidence that financial markets are not to be trusted.

But you will never, ever, hear this fact from the financial press.

A financial system based on lies and deceptions cannot forever last.

Friday, February 17, 2012

CBO: Longest Period of High Unemployment Since Great Depression

Source: US News - February 17, 2012
After three years with (U3) unemployment topping 8 percent, the U.S. has seen the longest period of high unemployment since the Great Depression, the Congressional Budget Office noted in a report issued today.

And, despite some recent good news on the economic front, the CBO is still predicting that (U3) unemployment will remain above 8 percent until 2014. The report also notes that, including those who haven’t sought work in the past four weeks and those who are working part-time but seeking full-time employment, the (U6) unemployment rate would be 15 percent.


The CBO made its comments in a report examining the long-term effects of joblessness, and possible policy options to boost employment, including unemployment insurance reforms and job training programs. The report came at the request of  Michigan  Democratic Rep. Sander Levin, but Republicans quickly jumped on the chance to bash President Obama’s stimulus program, which is also reaching its three-year anniversary today.

Tuesday, January 10, 2012

December Payroll Jobs Report


By: Paul Craig Roberts| January 6, 2012


The following report is based on the work of statistician John Williams of shadowstats.com.

Today’s (Friday, January 6) payroll jobs report of 200,000 new jobs in December is overstated by at least 82,000 jobs. As approximately 130,000 new jobs are needed each month to stay even with population growth, the December job figures actually indicate that the US economy fell another 12,000 jobs behind.

Forty-two thousand of the reported jobs are the result of a glitch in the BLS seasonal adjustment model that produces a false jump in December “couriers and messengers” jobs.

Forty thousand of the jobs result from the “birth/death” model that BLS uses to estimate the net effect of unreported jobs lost from business closures and jobs gained from new start-ups. The model is structured to represent normal times. During the bottom bouncing of this protracted downturn, the model over-estimates new jobs from start-ups and under-estimates job losses from business failures.

The official unemployment rates (U3 and U6) no longer measure all of the unemployed. The Clinton administration ceased counting as unemployed workers who had given up looking for a job for one year or longer. No discouraged workers are included in the widely reported U3 measure. The U6 measure includes workers who have been discouraged for less than one year.

In other words, the longer an economy is in the doldrums, the less the official unemployment rates are reliable measures of the extent of unemployment. The unemployment rate in December as measured by U3 is 8.5%; as measured by U6 which includes short-term discouraged workers (less than one year) is 15.2%. John Williams’ measure which includes the long-term unemployed is 
22.4%.

In other words, the real unemployment rate is 2.6 times the widely reported U3 rate, which is the rate emphasized by policymakers and the financial press.

Friday, January 6, 2012

Alternate Unemployment Charts - The REAL Numbers


The seasonally-adjusted SGS Alternate Unemployment Rate reflects current unemployment reporting methodology adjusted for SGS-estimated long-term discouraged workers, who were defined out of official existence in 1994. That estimate is added to the BLS estimate of U-6 unemployment, which includes short-term discouraged workers.

The U-3 unemployment rate is the monthly headline number. The U-6 unemployment rate is the Bureau of Labor Statistics’ (BLS) broadest unemployment measure, including short-term discouraged and other marginally-attached workers as well as those forced to work part-time because they cannot find full-time employment.


 Courtesy of ShadowStats.com