Showing posts with label healthcare. Show all posts

Thursday, February 6, 2014

Why Ordinary Food Will be the Future of Medicine

The Health Care Doctors Forgot
by T. COLIN CAMPBELL


The Problem

Few issues have become so intensely debated and politically charged as the need to reform the health care system. This debate has resulted in the ObamaCare program (The Affordable Care Act), which aims to expand and improve health care, thereby reducing health care costs.

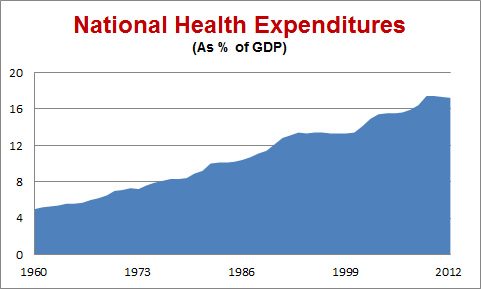
Presently, US health care costs constitute 18% of GDP, up from about 5% around 1970 (1). These costs are burdensome and many sectors of our society are paying the price. School programs are being scaled back because of the escalating costs of retiree health care benefit programs, as illustrated in Michigan where they are “laying off teachers, scrapping programs and mothballing extracurricular activities…[because of]…health care bills of retirees.“(2). About 60% of personal bankruptcies are now attributed to medical care costs (3) and these rising costs are eroding family incomes (4), among many other devastating outcomes.

It is also far from evident that the almost four-fold increase in the costs of healthcare (as a percent of our dollars) since the 1970s is leading to better health outcomes.

A solution is urgently needed but, in my opinion, this will not happen if we depend on the health care reform proposals offered in recent years, either from the political right or the political left. These proposals mostly concern who will pay a bill that is dependent on the use of expensive pills and procedures. This is not the needed solution because it ignores a strategy that decreases demand for services by improving health.

Current prevention programs are inadequate

Present day wellness programs are mostly cosmetic. Advisories to quit smoking, wear seat belts, use stairs not elevators, monitor blood pressure, use alcohol in moderation, and exercise regularly, make medical sense but, except possibly for smoking cessation, I don’t see how they can have much effect on improving health and reducing health care costs. Similarly, the United States Department of Agriculture makes dietary recommendations (think Food Pyramid) but these also are modest, at best, and highly questionable at worst (5).

As a consequence, by relying on modest or ineffective dietary and lifestyle recommendations (6,7) the health care system as a whole allows, even encourages, the use of very expensive pills and procedures. Consider, for example, the preventive component of the new ObamaCare program (3). This program wants to offer “free preventive women’s services, including mammograms,” to ensure “that there are no out-of-pocket costs on patients receiving … colonoscopies and provide lower prescription drug costs for people on Medicare.” These will cost money but there is little evidence they will significantly improve overall outcomes (8-10).

Much the same criticism can be made of personalized medicine and other projects of corporations (11) and governments (12) to target medical interventions to specific organs, ailments and individuals (14). I can find little or no evidence that these measures will improve health and decrease demand for health care services. In fact, I suggest (and the pharmaceutical industry hopes) that the thrust of personalized medicine will increase the use of pharmaceuticals as doctors will target illnesses detected earlier.

Add to this the alarming statistic that the third leading cause of death in the U.S. is the use and misuse of pills and procedures (15). Is it any wonder we have an ineffective, costly health care system? Our health care system is travelling a path to self-destruction, regardless of who pays the bill.

The solution

When I examine the various proposals made in recent years to reform this system, I see all as having one remarkably consistent omission. It is our neglect of the remarkable ability of nutrition to promote health and decrease illness. I particularly refer to the emerging evidence on the exceptional health benefits provided by a whole food plant-based (WFPB) diet—or should I say, re-emerging evidence. Re-emergence because the idea of the healing power of food has been around at least since the time of ancient Greece. Hippocrates said it best when he exclaimed, “Let food be thy medicine.”

“Let food be thy medicine.”

I am referring here not only to the well-known ability of nutrition to prevent diseases like heart disease, cancer and diabetes but to the ability of the WFPB diet to actually treat and thus reverse diseases that are already diagnosed or forecast by out-of-range risk factors.

A WFPB diet (5) is defined as one rich in antioxidants and complex carbohydrates. It also avoids animal-based foods, refined carbohydrates, and added fat typically used to make processed, convenience foods. The remarkable health benefits of the WFPB diet is attributed to its being naturally low in fat (10-12% of diet calories), low in protein (10-12% of calories), high in complex carbohydrates (75-80% of calories) and abundant in natural vitamins and minerals.

The science behind a WFPB diet is compelling. A WFPB lifestyle is effective in the short and long terms against a broad spectrum of diseases and ailments (16,17). Population-level studies show lower chronic disease rates the closer diets approximate the nutritional composition of a WFPB dietary lifestyle (7,18). That is, these population studies show the effects on a long term basis and that this dietary lifestyle serves the body’s innate biological tendency to repair itself and so constantly create health. But a WFPB diet can also act to reverse disease progression in a manner that is surprisingly fast (a few days to a few weeks). Such a diet can therefore function as a medical treatment.

The remarkable treatment effects are best documented in a clinical trial for patients with advanced heart disease (19-21). In one published study (19), seriously ill heart patients (i.e., 49 cardiac events during eight years prior to dietary intervention) cured themselves of coronary heart disease by adopting the WFPB dietary lifestyle. Now, 26 years later, five have passed but none from coronary disease (22). Additionally, the occurrence of cancer in these individuals is only about 10% of that expected (23). These results are unprecedented in a clinical trial.

In a 74-week study on type 2 diabetics (24), a close approximation of the WFPB diet decreased body weight, serum HbA1c (the preferred clinical indicator for Type 2 diabetes) and blood lipid levels even more than a companion group who adopted the traditional American Diabetes Association diet (25). The WFPB dietary effect is so pronounced that in our experience it may cause hypoglycemic shock among those who continue their insulin enhancing medications (personal communications: J McDougall, N. Bernard, and TN Campbell).

Additionally, a rich body of evidence has come to light in recent years to support the ability of a WFPB diet to suspend progression of, or even reverse, serious diseases like melanoma (26), prostate cancer (27), multiple sclerosis (28), rheumatoid arthritis (McDougall, J. Diet: only hope for arthritis. McDougall Newsletter (2002) and many other diseases (5). The breadth of this dietary effect both to prevent and to reverse such a diversity of diseases and ailments is truly remarkable.

Much of the benefit of a WFPB diet originates from the avoidance of cow’s milk protein, the most biologically active protein of animal origin yet known, which in experiments markedly promotes cancer development (29-31). A discussion of the multiple mechanisms accounting for this effect on cancer may be found elsewhere (5). Cow milk also elevates serum cholesterol (total, LDL) as well as early lesions that lead to heart disease (32, 33), decreases the production of cells that repair heart vessel damage (34) and is the major cause of early childhood allergies (35, 36).

It is now abundantly clear that the health restoring effect offered by the WFPB diet is greater than that of modern medicine. The WFPB treats a broader range of diseases, it is more effective, and it acts just as fast or even faster. Nor, importantly, is it typically reliant on a detailed diagnosis. Were a composite pill made containing the best of all known pharmaceutical drugs, such a pill could not compare with the benefits of a WFPB diet. When the lesser side effects are taken into account, it is no contest. Thus nutrition is now in a position to displace modern medicine as the treatment of choice for chronic disease.

Seeing the diet, not the nutrient

A common question asked by many people is why has this remarkable information not been widely shared and why is it so foreign for so many people. Sad to say, the general topic of nutrition—irrespective of any particular brand of nutrition—is almost never taught in medical schools and receives only meager funding from federal agencies. As a result, the public must rely on corporate messages (generously offered) that are far more concerned about marketing products, not about promoting human health. These messages are supported, if at all, only by evidence obtained on out-of-context nutrient-rich products and supplements.

I acquired this more comprehensive view of nutrition after spending decades initiating and directing well-funded academic research and teaching programs in nutritional science (my funding was obtainable because it was deemed cancer research!) and after participating for decades on expert panels in food and health policy development. My own community of nutrition research colleagues has been doing honorable, sincere work for a long time, but we also have been working within a paradigm that is largely responsible for miscommunicating this science to the public. We are good at researching details but come up short describing how these details can be assembled into a fabric of information that is useful for the public. We work well with the threads of the tapestry, not on the tapestry itself, unless that tapestry is woven to please the gods of the corporate world.

The food and drug corporate complex increasingly infiltrates and corrupts academic research (5). It also helps steer food and health policy and public nutrition information in a direction of their liking. Such mischief becomes possible because of a fundamental flaw in how we think about the concepts of biology, nutrition and medicine. We focus on parts but fail, miserably, to see the whole. When we rely only on parts, almost any health claim can be made to look good. This deeply embedded reductionist practice occurs in response to a “free market system” that requires a system of intellectual property protection that depends on a description of parts, appropriately patented and specifically described. In nutrition, this means relying on individual nutrients; in medical practice, this means relying on drugs.

The food and drug corporate complex increasingly infiltrates and corrupts academic research

Nowhere, in my opinion, is this flaw of worshipping biological parts rather than the whole more damaging than it is in the science of nutrition and in the practice of medicine. In reality, nutritional efficacy is wholistic (‘w’ intended) but our research investigations of nutrition are reductionist. Reductionist details, when presented in isolation, cause massive confusion. As a result, everyone pays, both with their wallets and in lost health. Also, because the practice of medicine is constrained by procedures and treatments within a reductionist paradigm, it follows that wholistic nutrition does not fit into this practice. This is an extremely costly mismatch, with tragic consequences on so many accounts.

If there is a realistic hope of resolving the health care crisis, which extends into so many sectors of our society and our planet, it must begin by accepting nutrition as a wholistic concept. Communicating this to the public suggests that nutrition scientists should take the lead but, in doing so, it will be necessary for the academic community to cleanse itself of the numbing stranglehold of corporate control. Only by doing so can this professional community generate the public support that our discipline richly deserves.

To summarize, adoption of the WFPB dietary lifestyle offers far more health benefits than the modern medical system. For those who comply, current evidence shows that at least 90% of all cardiovascular disease and type 2 diabetes, upwards of 70% of all cancers, and a broad spectrum of other illnesses can be prevented, even cured. Assuming that this message is effectively communicated, I estimate that at least 75% of contemporary health care costs could easily be saved. Sparing the side effects (often death) of the existing system would be a very large additional bonus.

It is now time to replace the current medical-based disease care system with a diet-based health care system as Hippocrates prompted us to think about two and a half thousand years ago. We face some extraordinary problems, health improvement, health care costs, serious environmental disarray, unforgiving violence and political polarization and discord. We are entitled to despair but only if we continue to rely on the same medical and health strategies that got us to this place. Based on the extraordinarily positive responses that I personally receive in my hundreds of lectures and the millions of readers of our books, I am optimistic. All we need to do is 1) honestly demonstrate this effect to the public and 2) develop affordable and convenient programs to facilitate transition and I am confident that exceptional progress can be made.

For the skeptics of this information, I say try it. You will see for yourself. Far more evidence for this opinion is available in The China Study (2005) (5) and in Whole (2013) (37) and also: Esselstyn, C. J. Prevent and reverse heart disease. (Avery Publishing, Penguin Group, 2007), Ornish, D. et al. “Can lifestyle changes reverse coronary heart disease?” Lancet 336, 129-133 (1990) and essays and books at <http://www.drmcdougall.com/health_10_day_program.html>. See also the websites: http://www.pcrm.org/, www.chiphealth.com/‎, and http://www.healthpromoting.com.


Footnote: Also, an online course on this topic (with 30 Category I CME and CEU credits) is available at nutritionstudies.org.

References
1 Baker, S. L. U.S. national health spending, 1960-2011. (2013). .

2 French, R. Michigan’s education time bomb: costly, loophole-ridden retirement system threatens public schools. (2007).

3 Anonymous. ObamaCare facts: facts on the Obama health care plan, (2013).

4 Auerback, D. I. & Kellermann, A. L. A decade of health care cost growth has wiped out real income gains for an everage US family. Health Affairs 30, 1630-1636 (2011)

5 Campbell, T. C. & Campbell, T. M., II. The China Study, Startling Implications for Diet, Weight Loss, and Long-Term Health. (BenBella Books, Inc., 2005).

6 Committee on Diet Nutrition and Cancer. Diet, Nutrition and Cancer. (National Academy Press, 1982).

7 Expert Panel. Food, nutrition and the prevention of cancer, a global perspective. (American Institute for Cancer Research/World Cancer Research Fund, 1997).

8 Gotzsche, P. C. & Jorgensen, K. J. Screening for breast cancer with mammography. Cochrane Database of Systematic Reviews, doi:10.1002/14651858.CD001877.pub5 (2013).

9 Blennerhassett, M. Breast cancer screening: an ethical dilemma, or an opportunity for openness? Qual. Prim. Care 21, 39-42 (2013).

10 Erpeldinger, S. et al. Is there excess mortality in women screened with mammography: a meta-analysis of non-breast cancer mortality. Trials 14, 368 (2013).

11 Anonymous. Drug discovery & development (2013).

12 Stribley, L., Egbuonu-Davis, L. & Fritz, P. The federal government’s key role in healthcare innovation.

13 Lindpaintner, K. Genetics in drug discovery and development: challenge and promise of individualizing treatment in common complex diseases. Brit. Med Bull. 55, 471-491 (1999).

14 Anonymous. Personalized medicine. Wikipedia (2013). And Chaufan and Joseph (2013) The ‘Missing Heritability’of Common Disorders: Should Health Researchers Care? International Journal of Health Services 43: 281 – 303

15 Starfield, B. Is US health really the best in the world? JAMA 284, 483-485 (2000).

16 Campbell, T. N. Personal communication. (2012-13).

17 Esselstyn, C. B. J., Gendy, G., Doyle, J., Golubic, M. & Roizen, M. F. Treating the cause of coronary artery disease (to be published). J Family Practice (2014).

18 Doll, R. & Peto, R. The causes of cancer: Quantitative estimates of avoidable risks of cancer in the Unites States today. J Natl Cancer Inst 66, 1192-1265 (1981).

19 Esselstyn, C. B., Jr. Updating a 12-year experience with arrest and reversal therapy for coronary heart disease (an overdue requiem for palliative cardiology). Am. J. Cardiol. 84, 339-341 (1999).

20 Morrison, L. M. Diet in coronary atherosclerosis. JAMA 173, 884-888 (1960).

21 Ornish, D. et al. Can lifestyle changes reverse coronary heart disease? Lancet 336, 129-133 (1990).

22 Fulkerson, L. Forks over Knives; referring to Esselstyn patients 92 min (Monica Beach Productions, Santa Monica, CA, 2011).

23 Esselstyn, C. J. Personal communication. (2011-2013).

24 Barnard, N., Cohen, J. & Ferdowsian, H. A low-fat vegan diet and a conventional diabetes diet in the treatment of type 2 diabetes: a randomized, controlled, 74-wk clinical trial. Am. J. Clin. Nutr. 89, 1588S-1596S (2009).

25 Franz, M. J. et al. Evidence-based nutrition principles and recommendations for the treatment and prevention of diabetes and related complications. Diabetes Care 26, S51-S61 (2003).

26 Hildenbrand, G. L. G., Hildenbrand, L. C., Bradford, K. & Cavin, S. W. Five-year survival rates of melanoma patients treated by diet therapy after the manner of Gerson: a retrospective review. Alternative Therapies in Health and Medicine 1, 29-37 (1995).

27 Frattaroli, J. et al. Clinical events in prostate cancer lifestyle trial: results from two years of follow-up. Urology 72, 1319-1323 (2008).

28 Swank, R. L. Effect of low saturated fat diet in early and late cases of multiple sclerosis. Lancet 336, 37-39 (1990).

29 Campbell, T. C. Chemical carcinogens and human risk assessment. Fed. Proc. 39, 2467-2484 (1980).

30 Madhavan, T. V. & Gopalan, C. The effect of dietary protein on carcinogenesis of aflatoxin. Arch. Path. 85, 133-137 (1968).

31 Youngman, L. D. & Campbell, T. C. Inhibition of aflatoxin B1-induced gamma-glutamyl transpeptidase positive (GGT+) hepatic preneoplastic foci and tumors by low protein diets: evidence that altered GGT+ foci indicate neoplastic potential. Carcinogenesis 13, 1607-1613 (1992).

32 Meeker, D. R. & Kesten, H. D. Experimental atherosclerosis and high protein diets. Proc. Soc. Exp. Biol. Med. 45, 543-545 (1940).

33 Meeker, D. R. & Kesten, H. D. Effect of high protein diets on experimental atherosclerosis of rabbits. Arch. Pathology 31, 147-162 (1941).

34 Foo, S. Y. et al. Vascular effects of a low carbohyrdate high protein-diet. Proc. National Acad. Sci 106, 15418-15423 (2009).

35 Vandenplas, Y., Steenhout, P., Planoudis, Y., Grathohl, D. & Althera Study Group. Treating cow’s milk allergy: a double-blind randomized trial comparing two extensively hydrolysed formulas with probiotics. Acta Paediatr. 102, 990-998 (2013).

36 Katz, A., Virk H., N., Yuan, Q. & Shreffler, W. Cows’ milk allergy: a new approach needed? J. Pediatr. 163, 620-622 (2013).

37 Campbell, T. C. Whole. Rethinking the science of nutrition. (BenBella Books, 2013).

This article originally appeared on Independent Science News.

Friday, January 17, 2014

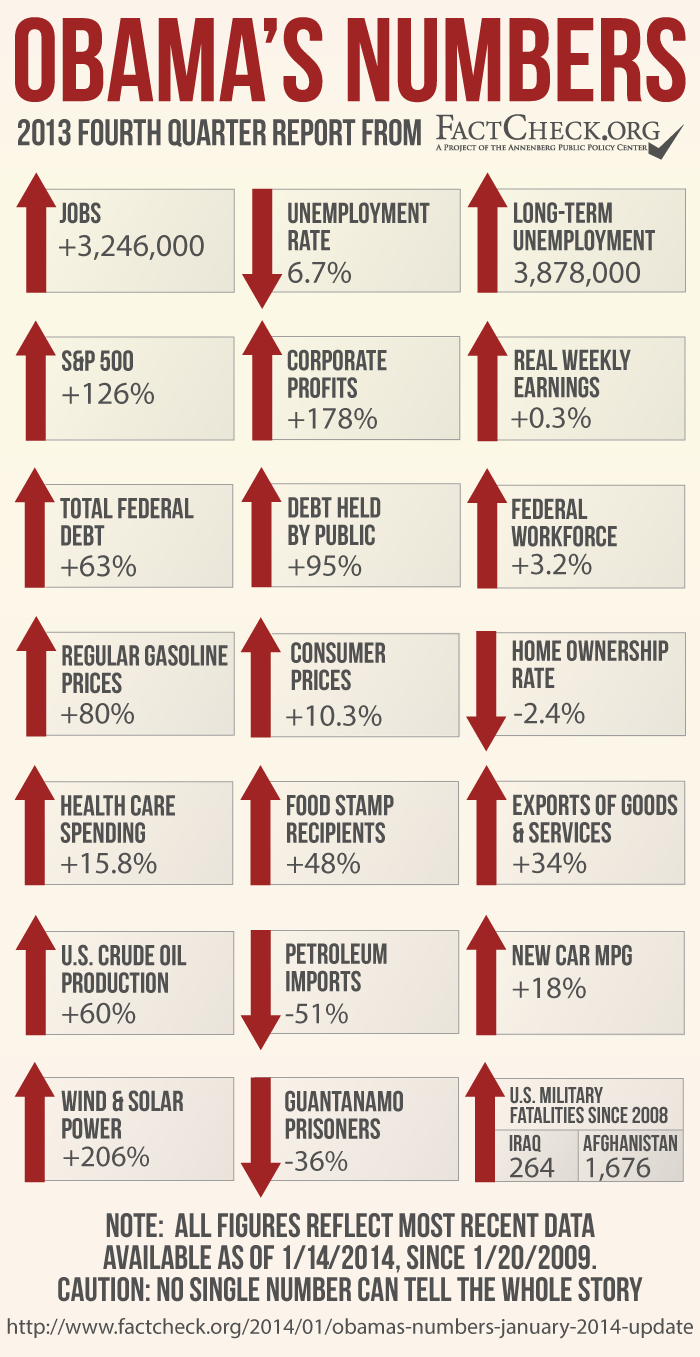
Obama’s Numbers (January 2014 Update - FactCheck.org)

Latest statistics show stagnant wages, persistent long-term joblessness, soaring profits and stock prices, and moderating health care spending.
January 15, 2014 / FACTCHECK.org

Summary

As we do every three months, we are updating our “Obama’s Numbers” report with fresh statistics reflecting what has happened since the president first took office.

Some highlights from this round:

The economy continues to gain jobs, but the number of long-term unemployed is nearly double what it was when Obama became president.

Wages remain stagnant,
increasing a scant 0.3 percent after inflation during Obama’s time. Meanwhile corporate profits are running 178 percent higher than just before he took office, and stock prices have doubled.

The number of low-income persons on food stamps remains just below the record level reached in 2012, with 15 percent of the population still getting benefits.

Health care spending has increased 15.8 percent under Obama, which is faster than inflation but modest by historical standards. But there’s scant evidence that the Affordable Care Act is causing the slowdown. The government economists and statisticians who track the spending said the law’s impact has been “minimal.”

U.S. exports have gone up just 34 percent — leaving the president far short of his announced goal of doubling them by the end of this year.

The number of suspected terrorists held prisoner at Guantanamo — which the president once ordered closed by January 2010 — is down only 36 percent.

The federal debt owed to the public has nearly doubled since Obama was sworn in, increasing by 95 percent.


Analysis

This report follows our October 2013 update and previous quarterly reports dating back to our first “Obama’s Numbers” article in October 2012. All figures here reflect the most recent available as of Jan. 14.


Jobs

As of December, the economy had gained a net total of 3,246,000 jobs since Obama first took office, and the unemployment rate had fallen to 6.7 percent, down from 7.8 percent. But that's a misleading stat.

Despite the gains, more than 10 million people remained unemployed, including 3.9 million who had been out of work for 27 weeks or longer. That’s an increase of nearly 1.2 million “long-term unemployed” since the start of the Obama presidency.

The average time that an unemployed person in December had been looking for work was 37 weeks, nearly double the average at the time Obama entered the White House.

Another troubling jobs statistic is the civilian labor force participation rate, which has now declined by 2.9 percentage points since Obama became president, to the lowest point since 1978. But that’s not entirely due to discouraged workersdropping out because they believe no jobs are available, as some Obama critics would have you believe.

Other labor-force dropouts include members of the baby-boom generation, who are retiring in droves. They also include disabled workers gaining Social Security disability benefits (a number that has doubled in the past 17 years, and is up 20 percent just since Obama took office).

There’s a lively debate among economists about the causes — and implications — of the shrinking participation rate, which started long before Obama took office. The rate actually peaked in early 2000 and declined 1.5 percent under Obama’s predecessor. A Labor Department economist, looking at current demographic trends, predicts further declines through at least 2022 — long after the end of Obama’s presidency.


Slowing Health Care Costs

Health care costs have risen only moderately since Obama took office, but not for the reason the White House wants you to think.

The most recent official figures were posted by the Centers for Medicare & Medicaid Services, whose nonpartisan economists and statisticians have tracked health care spending since 1960. CMS officials also published their findings in a Jan. 6 article in the journal Health Affairs.

The figures show health care spending in the U.S. rose 3.7 percent in 2012, and stood 15.8 percent higher than it did in 2008, the year before Obama took office.

That’s moderate by historical standards. And the White House was quick to claim credit.

Jason Furman, chairman of the president’s Council of Economic Advisers, published an op-ed piece in the Wall Street Journal Jan. 6 under the headline, “ObamaCare Is Slowing Health Inflation.” In the body of the piece, he argued that the slowdown in health costs is due “in part” to the Affordable Care Act, which he said is making a “meaningful” contribution. He cited, for example, the law’s provision penalizing hospitals if too many patients need to be readmitted, which he said has helped reduce hospital readmission rates by more than 1 percentage point.

But the nonpartisan number-crunchers at CMS said in their Health Affairs article that the ACA had only a “minimal” impact on the slowdown in spending. The reasons they cited instead were:
The economic slowdown and subsequent sluggish recovery
Drops in some prescription drug costs brought about by the expiration of patents on several costly medications including Lipitor, Plavix and Singulair, which are now available in low-cost generic versions, and
A one-time reduction in Medicare payment levels to skilled nursing facilities.

The Health Affairs authors suggested the slowdown in health spending may only be temporary, as has been the case after past recessions.


Health care spending consumed a record 17.4 percent of the nation’s entire economic output in the recession-plagued year of 2009. That declined only slightly, to 17.2 percent, in 2012.

“[T]his pattern is consistent with historical experience when health spending as a share of GDP often stabilizes approximately two to three years after the end of a recession and then increases when the economy significantly improves,” the authors said.

To conclude that the slowdown is permanent, they said, would require “more historical evidence.”


Moderate Inflation

Other costs have risen even more slowly under Obama. As of November, the Consumer Price Index has risen 10.3 percent since he first took office. Some policymakers even worry the inflation rate might be too low — foreshadowing sluggish economic growth in the future.

The highly visible (and highly volatile and highly politicized) price of regular gasoline stood at a national average of $3.33 per gallon in the week ended Jan. 13. That’s more than half a buck cheaper than it was in September 2012, when Republicans were making it an election issue. The recent price is 80 percent higher than it was when Obama took office in the midst of a worldwide recession, which had dampened demand. But the price under Obama has never equaled the historic high of more than $4 per gallon that it reached in June and July 2008, before he took office.


Disappointing Exports

The president has a long way to go to meet his goal of doubling exports of U.S. goods and services, which he first made in his 2010 State of the Union address. So far, exports have increased only 33.6 percent since Obama took office, according to data from the U.S. Commerce Department. (We compared seasonally adjusted figures for the fourth quarter of 2008 with those for the July – September quarter of 2013, the most recent figures available.)

Obama is facing the same global economic headwinds that he did six months ago, when we last updated the export figure. Simply put, overseas customers are still struggling. European unemployment is stuck at 12 percent, for example. And China’s economic growth has slowed and remains problematic. The president mentions his 2010 National Export Initiative on occasion. But at the current rate he won’t come close to meeting his original goal of doubling exports by the end of 2014.


Rising Federal Debt

The president is fond of boasting that annual federal deficits are falling rapidly. But they remain large by historical standards. And the fact is, they are piling up.

Total federal debt now stands at nearly $17.3 trillion, which is 63 percent higher than when Obama took office. That figure includes money the government owes to itself, chiefly through the Social Security trust funds.

A figure that economists consider more important — the debt the government owes to the public — has risen even more dramatically. That figure now stands at $12.3 trillion, an increase of 95 percent under Obama. At the current rate it will surely rise to a doubling during Obama’s presidency — possibly by the time of our next update three months hence.

Net interest payments consumed 6.4 percent of all federal spending in the fiscal year that ended Sept. 30. And the nonpartisan Congressional Budget Office officially projects that interest payments will gobble up an even bigger share of federal spending in the future. “CBO expects interest rates to rebound in coming years from their current unusually low levels, sharply raising the government’s cost of borrowing,” CBO said in its most recent long-term budget outlook document.


Government Workers

While cash-strapped state and local governments have been laying off teachers, firefighters, police and other workers, the federal government has increased the number of its employees under Obama.

The most recent figures from the Bureau of Labor Statistics show that as of December, workers on the federal payroll (excluding postal workers) numbered more than 2.1 million, up 3.2 percent since January 2009.

During the same time, the number of workers on state payrolls went down 3 percent and those on local government payrolls declined by 3.5 percent. A big reason for the disparity is that state and local governments generally must balance their spending and income each year, while the federal government can keep up spending by borrowing.

The figures also show that in recent months state and federal governments have been able to hire back some of their laid-off workers. Obama’s hiring spree also peaked in 2011 (ignoring spikes in hiring of temporary Census workers in 2010), and the number of non-postal federal workers has gone down more or less steadily during the budget battles of the past two years. But the number is above where it was when he took office.


Stagnant Wages, Record Corporate Profits

The divide between the affluent and ordinary wage earners — which the president last month called the “defining challenge of our time” — has widened during his time in office.

Wages remain stagnant, barely keeping up with inflation. Average weekly earnings of workers on payrolls, measured in inflation-adjusted dollars, have edged up a scant 0.3 percent between Obama’s first month in office and November 2013, the most recent on record. And there’s no clear upward trend. We reported a 0.1 percent increase in the real earnings figure in our July update six months ago, but that had evaporated by the time of our October update three months later, when the figure was exactly zero.

Relatively fewer people now own their own homes. Under Obama, the home ownership rate has declined by 2.4 percentage points, to 65.1 percent in the July-September quarter, according to U.S. Census figures. (The decline actually began in 2004, when the rate peaked at 69.4 percent as the housing bubble was inflating.)

And the number of low-income persons on food stamps (now called Supplemental Nutrition Assistance, or SNAP) continues at near-record levels. The most recent figures from the Department of Agriculture put the number receiving benefits at just over 47.4 million as of October — or 15 percent of the entire U.S. population.

That’s down a bit from the nearly 47.8 million record set in December 2012. But it is still an increase of 48.3 percent during Obama’s presidency.

The increase in food stamp beneficiaries is due partly to economic pressures, but also to liberalizations in both benefits and eligibility under President Obama and also under his predecessor. We covered those in some detail back in 2012 when GOP presidential candidate Newt Gingrich accused Obama of being the “food stamp president.” The number of food stamp beneficiaries increased by 14.7 million during Bush’s two terms in office, and is up another 15.4 million under Obama.

One factor behind Obama’s increase is that benefit levels were raised in 2009 as part of his economic stimulus program. That “temporary” increase was extended several times, and didn’t lapse until Nov. 1 last year.

But while wage earners and low-income people struggle, corporate profits keep setting records. Even after taxes, corporate profits were running at an annual rate of nearly $1.9 trillion in the July-September quarter of last year, the most recent for which figures are available. That’s nearly triple the rate during the three months before Obama became president — an increase of 178 percent.

To be sure, that last quarter of 2008 was the worst since 2002, thanks to the worst business recession since the Great Depression. But profits rebounded to well above previous levels. Profits in the most recent quarter were running 33 percent higher than the highest level seen before 2009, which was the third quarter of 2006, when profits ran at a rate of $1.4 trillion.

Obama’s time in office also has been good for those who own corporate stocks — whose values have doubled and more under Obama. As of the close of the market on Jan. 14, the Standard & Poor’s 500 stock index was 128 percent higher than it was when Obama first took office.

Other market indicators also have soared. The Dow Jones Industrial Average was up 106 percent, and the NASDAQ Composite index had nearly tripled, rising by 190 percent.


Booming Oil, Gas, Wind and Solar

The remarkable and historic boom in U.S. oil and gas production continues. Production of crude oil in the U.S. now has increased 60 percent since Obama took office, while imports of foreign oil and petroleum products have declined by 51 percent, as measured by the most recent Energy Information Administration figures, comparing the most recent three-month period with the last quarter of 2008.

As a consequence, U.S. dependency on imported oil has dropped sharply. The nation imported 34 percent of what it consumed in the first 11 months of 2011, according to the most recent EIA figures. (See Table 3.3a, “net imports” as a percent of “product supplied.”) That’s a drop of 23 percentage points from 2008, when the U.S. imported 57 percent. The decline actually began in George W. Bush’s second term, after U.S. dependency peaked at 60.3 percent in 2005. But the trend has gathered momentum under Obama.

As we’ve said before, the U.S. energy boom is a result primarily of the use of new drilling technology by the industry, not of any policy changes in Washington. But the president hasn’t been in any hurry to impose restrictions on the hydraulic fracturing method. The Environmental Protection Agency has been studying the impact of “fracking” on drinking water for years. It announced the study March 18, 2010, and issued a “progress report” Dec. 21, 2012. The EPA says it expects a draft report to be released for scientific peer review sometime this year.

Another factor behind reduced U.S. dependency on imported oil is more fuel-efficient automobiles. The latest figures from the University of Michigan’s Transportation Research Institute show the average EPA city/highway “window sticker” mileage of cars and light trucks sold in December was 24.8 miles per gallon, an improvement of 18 percent over the average for vehicles sold in the month that Obama took office.

Washington is now calling for even greater efficiency in the future. The Obama administration has put in place requirements that cars and light trucks average 54.5 mpg by model year 2025. But it remains to be seen whether the industry can produce such vehicles and get Americans to buy them, and whether future presidents will stick to Obama’s ambitious goal.

Under Obama, wind and solar power has tripled. In the most recent 12 months on record (ending in October) electricity generated by wind and solar had increased by 206 percent over the total for 2008. That was spurred in part by large federal tax subsidies for wind and solar generation.

Despite the large percentage increase in wind and solar generation, such energy accounted for just under 3.2 percent of all electricity generated in the U.S. in the July-September quarter of 2013, the most recent on record. Coal still accounts for the biggest share, followed by natural gas and nuclear power.

War and Terrorism

The detention facility for suspected terrorists remains open at the Guantanamo Naval Base in Cuba, despite the order Obama signed two days after taking office, directing that it be closed within one year. On Dec. 31 the U.S. announced it was releasing three more prisoners — all ethnic Uighur Chinese nationals — and transferring them to Slovakia, which had agreed to resettle them. But that leaves 155 “detainees” in custody (the Pentagon prefers not to call them “prisoners”), a number just 36 percent below the 242 who were being held nearly five years ago when Obama became president.

And the war in Afghanistan grinds on. According to official Pentagon figures, the U.S. has suffered a total of 1,676 military fatalities since 2008 in Operation Enduring Freedom.

Since 2008, a total of 264 U.S. military fatalities were attributed to the two Iraq war operations, Operation Iraqi Freedom and Operation New Dawn, according to official Pentagon figures. Although the last U.S. troops left Iraq at the end of 2011, two deaths were attributed to the conflict in 2012: Marine Staff Sgt. Oscar Eduardo Canon, who died in February 2012 of wounds suffered earlier, and Army Staff Sgt. Ahmed Kousay al-Taie, who had been missing since 2006 and whose remains were identified in February 2012.

– by Brooks Jackson
Sources

Bureau of Labor Statistics. “Employment, Hours, and Earnings from the Current Employment Statistics survey (National); Total Nonfarm Employment, Seasonally Adjusted.” Data extracted 14 Jan 2014.

Bureau of Labor Statistics. “Labor Force Statistics from the Current Population Survey; Unemployment Rate, Seasonally Adjusted.” Data extracted 14 Jan 2014.

Bureau of Labor Statistics. “Labor Force Statistics from the Current Population Survey; Unemployment Level, Seasonally Adjusted.” Data extracted 14 Jan 2014.

Bureau of Labor Statistics. “Labor Force Statistics from the Current Population Survey; Number Unemployed for 27 Weeks & Over, Seasonally Adjusted.” Data extracted 14 Jan 2014.

Bureau of Labor Statistics. “Labor Force Statistics from the Current Population Survey; Labor Force Participation Rate, Seasonally Adjusted.” Data extracted 14 Jan 2014.

Bureau of Labor Statistics. “Labor Force Statistics from the Current Population Survey; Not in Labor Force, Searched For Work and Available, Discouraged Reasons For Not Currently Looking, Unadjusted.” Data extracted 14 Jan 2014.

Social Security Administration. “Number of Social Security recipients—time series for selected benefit type: Disabled Workers.” Data extracted 14 Jan 2014.

Klein, Matthew C. “Is Jobless Rate Really Falling?” Bloomberg News. 9 Jan 2014.

Toossi, Mitra. “Labor force projections to 2022: the labor force participation rate continues to fall.” Monthly Labor Review. Dec 2013.

Martin, Anne B. and Micah Hartman, Lekha Whittle, Aaron Catlin and the National Health Expenditure Accounts Team. “National Health Spending In 2012: Rate Of Health Spending Growth Remained Low For The Fourth Consecutive Year.” Health Affairs. Jan 2014.

Furman, Jason. “ObamaCare Is Slowing Health Inflation.” Wall Street Journal. 6 Jan 2014.

Petrof, Alanna. “Euro zone unemployment at 12%, while U.S. improving.” CNN Money. 8 Jan 2014.

China’s Stocks Fall to Five-Month Low on Economic Growth Concern.” Bloomberg News. 5 Jan 2014.

White House. “Remarks by the President in the State of the Union.” 27 Jan 2010.

Bureau of Labor Statistics. “Consumer Price Index – All Urban Consumers.” Data extracted 14 Jan 2014.

Inflation, Strangely Low, Holds Key to 2014 Fed Policy.” Thompson/Reuters. 12 Jan 2014.

U.S. Energy Information Administration. “Weekly U.S. Regular All Formulations Retail Gasoline Prices.” Data extracted 14 Jan 2014.

Obama, Barack “Remarks by the President in State of the Union Address.” White House Office of the Press Secretary. 27 Jan 2010.

Petroff, Alanna. “Euro zone unemployment at 12%, while U.S. improving.” CNN Money. 8 Jan 2014.

China’s Stocks Fall to Five-Month Low on Economic Growth Concern.” Bloomberg News. 5 Jan 2014.

U.S. Treasury. “The Debt to the Penny and Who Holds It.” 10 Jan 2014. Data extracted 14 Jan 2014.

U.S. Treasury. “Final Monthly Treasury Statement of Receipts and Outlays of the United States Government For Fiscal Year 2013 Through September 30, 2013, and Other Periods.” Undated. Accessed 14 Jan 2014.

Congressional Budget Office. “The 2013 Long Term Budget Outlook.” Sept 2013.

Bureau of Labor Statistics. “Employment, Hours, and Earnings from the Current Employment Statistics survey (National); Government, Federal, except U.S. Postal Service, Seasonally Adjusted.” Data extracted 14 Jan 2014.

Bureau of Labor Statistics. “Employment, Hours, and Earnings from the Current Employment Statistics survey (National); Government, State Government, Seasonally Adjusted.” Data extracted 14 Jan 2014.

Bureau of Labor Statistics. “Employment, Hours, and Earnings from the Current Employment Statistics survey (National); Government, Local Government, Seasonally Adjusted.” Data extracted 14 Jan 2014.

Obama, Barack. “Remarks by the President on Economic Mobility.” White House Office of the Press Secretary. 4 Dec 2013.

Bureau of Labor Statistics. “Employment, Hours, and Earnings from the Current Employment Statistics survey (National); Average Weekly Earnings of All Employees, 1982-1984 Dollars.” Data extracted 14 Jan 2014.

U.S. Census Bureau. “Time Series: Seasonally Adjusted Home Ownership Rate.” Data extracted 14 Jan 2014.

U.S. Department of Agriculture, Food and Nutrition Service. “Supplemental Nutrition Assistance Program (Data as of January 10, 2014).” Data extracted 14 Jan 2014.

Plumber, Brad. “Food stamps will get cut by $5 billion this week — and more cuts could follow.” Washington Post Wonkblog. 28 Oct 2013.

Federal Reserve Bank of St Louis. “Corporate Profits After Tax (without IVA and CCAdj) (CP).” Data extracted 14 Jan 2014.

Google Finance. “S&P 500.” Historical prices. Accessed 14 Jan 2014.

Google Finance. “Dow Jones Industrial Average.” Historical prices. Accessed 14 Jan 2014.

Google Finance. “NASDAQ Composite.” Historical prices. Accessed 14 Jan 2014.

U.S. Energy Information Administration. “U.S. Crude Oil Production.” Accessed 14 Jan 2014.

U.S. Energy Information Administration. “Table 3.3a. Monthly Energy Review.” Dec 2013.

U.S. Energy Information Administration. “Table 1.1.A. Net Generation by Other Renewables: Total (All Sectors), 2003-April 2013.” Accessed 14 Jan 2014.

U.S. Environmental Protection Agency. “EPA Initiates Hydraulic Fracturing Study: Agency seeks input from Science Advisory Board.” News release. 18 Mar 2010.

U.S. Environmental Protection Agency. “EPA Releases Update on Ongoing Hydraulic Fracturing Study.” News release. 21 Dec 2012.

University of Michigan Transportation Research Institute. “Average sales-weighted fuel-economy rating (window sticker) of purchased new vehicles for October 2007 through December 2013.” 8 Jan 2014.

Obama Administration Finalizes Historic 54.5 MPG Fuel Efficiency Standards.” News release, White House Office of the Press Secretary. 28 Aug 2012.

U.S. Energy Information Administration. “Electric Power Monthly: Table 1.1.A. Net Generation from Renewable Sources: Total (All Sectors), 2003-October 2013.” 20 Dec 2013.

U.S. Energy Information Administration. “Electricity Data Browser: Net Generation.” Data extracted 14 Jan 2014.

Closure Of Guantanamo Detention Facilities: Executive Order – Review and Disposition of Individuals Detained at the Guantanamo Bay Naval Base and Closure of Detention Facilities.” The White House. 22 Jan 2009.

U.S. Department of Defense. “Detainee Transfer Announced.” News release. 31 Dec 2013.

U.S. Department of Defense, Defense Casualty Analysis System. “U.S. Military Casualties – Operation Enduring Freedom (OEF) Casualty Summary by Month.” Data extracted 14 Jan 2014.

U.S. Department of Defense, Defense Casualty Analysis System. “U.S. Military Casualties – Operation Iraqi Freedom (OIF) Casualty Summary by Month.” Data extracted 14 Jan 2014.

U.S. Department of Defense, Defense Casualty Analysis System. “U.S. Military Casualties - Operation New Dawn (OND) Casualty Summary by Month.” Data extracted 14 Jan 2014.

Shapiro, Joseph. “Remembering Marine Sgt. Oscar Canon, A ‘Superstar.’ ” National Public Radio. 24 Feb 2012.

Missing U.S. soldier killed by Shiite group.” The Associated Press. 27 Feb 2012.

Monday, September 30, 2013

People Want Full Medicare for All

Time for Single Payer
by RALPH NADER


Freshman Senator Ted Cruz (R-Texas), who somehow got through Princeton and Harvard Law School, is the best news the defaulting Democratic Party has had in years.

As the Texas bull in the Senate china shop, he has been making a majority of his Republican colleagues cringe with his bare-knuckle antics and language. His 21 hour talkathon on the Senate floor demanding the defunding of Obamacare made his Republican colleagues gasp. His Nazi appeasement analogies, and threats to shut down were especially embarrassing.

After listening to his lengthy rant on the Senate Floor on Tuesday and Wednesday, one comes away with two distinct impressions. Ted Cruz cannot resist inserting himself here, there and everywhere. And nothing is too trivial for Senator Talkathon. He likes White Castle hamburgers, he loves pancakes; he talked about what he liked to read as a little boy, where he’s traveled, what clothes he wears and other trivia.

You’d think he would have used his time to talk specifically about the suffering that uninsured people and their children are going through, especially in the Lone Star State. Or about what could replace Obamacare other than his repeated “free market” solution, which is to say the “pay or die” profiteering, tax-subsidized corporate system.

It was puzzling why he never mentioned that during his two days of talking, over two hundred Americans died, on average, because they couldn’t afford health insurance to get diagnoses and timely treatment. (A peer reviewed study by Harvard Medical School researchers estimated about 45,000 die annually for lack of affordable health insurance every year.)

The other reaction to Senator Cruz was that many of his more specific objections to Obamacare – its mind-numbing complexity, opposition by formerly supportive labor unions, and employers reacting by reducing worker hours below 30 hours a week to escape some of the law’s requirements – are well-taken and completely correctible by single-payer health insurance, as provided in Canada. Single-payer, or full Medicare for all, with free choice of physician and hospital has been the majority choice of Americans for decades. Even a majority of doctors and nurses favor it.

Single-payer’s advantage is that everybody is in, nobody is out. It is far more efficient, allows for better outcomes, saves lives, prevents injuries and illnesses, relieves people of severe anxieties and wasted time spent figuring out often fraud-ridden, inscrutable computerized bills and allows for the collection of pattern-detecting data to spot harmful trends.

For example, in Canada, full Medicare covers everyone at half the per capita cost that Americans pay even though 50 million Americans are still not covered. The U.S. per capita figure is almost $9,000 a year and over 17% of our total GDP. In Canada, administrative costs are much lower.

Symbolically, the single-payer legislation that passed in Canada over four decades ago was 13 pages long, compared to over two thousand pages for Obamacare.

Critics of Canada’s system charge it with delays for patients. For some elective procedures, provinces that were under-investing have experienced some delays until Ottawa raised its contributions. Canada spends just over 10% of its GDP on healthcare, by comparison.

But in the U.S. not being able to pay for treatment is the biggest problem. And in the U.S., who hasn’t heard of delays in various areas of the country due to lack of primary care physicians or other specialties? I have many friends and relatives in Canada who have not complained of delays for routine, essential or emergency treatments.

For those who prefer to believe hard-bitten businesspeople, Matt Miller, writing yesterday in The Washington Post, interviewed big business executives – David Beatty who ran the giant Weston Foods and Roger Martin long-time consultant to large U.S. companies in Canada. They were highly approving of the Canadian system and are baffled at the way the U.S. has twisted itself in such a wasteful, harmful and discriminatory system.

Mr. Beatty wondered why U.S. companies “‘want to be in the business of providing health care anyway’ (‘that’s a government function,’ he says simply).”

Mr. Martin, an avowed capitalist, who has experienced healthcare in the U.S. and Canada, according to Mr. Miller, called Canadian Medicare “incredibly hassle-free,” by comparison. (In Canada, single-payer means government insurance and private delivery of healthcare under cost controls). Now Dean of the business school at the University of Toronto, Mr. Martin told reporter Miller: “I literally have a hard time thinking of what would be better than a single-payer system.”

So why the U.S. is the only Western country without some version of a single-payer system?

Most concessionary Democrats, including Barack Obama and Hillary Clinton, have said in the past that they prefer single-payer, but that the corporate forces against it cannot be overcome. (They use phrases like “single-payer is not practical.”)

But with the Cruz crew in Congress going berserk against Obamacare, now is the time to press again for the far superior single-payer model. Or at least get single-payer into the public discussion. Unfortunately, even some of the major citizen groups organized for single-payer, behind H.R. 676, are keeping quiet, not wanting to undercut Obama and the Congressional Democrats.

Go to Single Payer Action and connect with the movement that does not play debilitating politics and seeks your engagement.

Thursday, September 13, 2012

Numbers, Analysis Show 30 Years of Failed US Economic Policy


Census numbers show persistent poverty, falling wages, and rising inequality
The latest US Census Bureau numbers on poverty, income inequality, and healthcare, coupled with newly released economic analysis of US public policy reveals the reality and the reasons behind the persistent rut of the poverty-stricken, the working-poor, and the middle class in America.

More than three years after the collapse of the housing bubble, the federal government's bailout of Wall Street, and the start of the Great Recession, the US poverty rate remains persistently high with nearly 1 in 5 Americans living at or below the poverty line, according to new figures released on Wednesday by the US Census Bureau.

In addition, the numbers show rampant joblessness, stagnant or falling wages among workers, household incomes that continue to fall, and an inequality gap that continues to grow.

Meanwhile, the Economic Policy Institute released their annual review of US economic policy which includes a wide variety of data on family incomes, wages, jobs, unemployment, wealth, and poverty that allow for a clear, unbiased understanding of the economy’s effect on the living standards of working Americans.

As the Census reports, "the nation's official poverty rate in 2011 was 15.0 percent, with 46.2 million people in poverty. After three consecutive years of increases, neither the poverty rate nor the number of people in poverty were statistically different from the 2010 estimates."

New data on the continued rise in inequality—where income inequality increased by 1.6 percent between 2010 and 2011—prompted Robert Greenstein, President of the Center on Budget and Policy Priorities, to underscore that the nation's wealthiest should begin to share in the sacrifices that will be needed to correct the economy in the coming years.

"Given the need for substantial sacrifice and the skewing of income gains to those at the top," he said in a statement, "it is difficult to justify extending the rather lavish tax cuts for high-income individuals that policymakers enacted in 2001 and 2003, which average $129,000 a year for people who make over $1 million a year, according to the Urban-Brookings Tax Policy Center."

The Economic Policy Institute, which on Tuesday released its 12th annual "State of Working America" report, listed the key numbers from the Census report:

Poverty

  • 15.0%: The share of the population in poverty in 2011
  • 21.9%: The percent of children under 18 in poverty
  • 46.2 million: The number of people in poverty in 2011
  • $22,811: The poverty threshold for a family of four with two children
  • 44.0%: The share of the poor population in “deep poverty,” or below half the poverty line
  • 2.3 million: The number of people unemployment insurance kept out of poverty in 2011
  • 21.4 million: The number of people Social Security kept out of poverty in 2011
  • 5.7 million: How many fewer people would be in poverty if the Federal Earned Income Tax Credit was included in the Census definition of money income
  • 3.9 million: How many fewer people would be in poverty if food stamps (SNAP) were added to money income

Income

  • -1.7%, +5.1%: The change in average household income between 2010 and 2011 for the middle 20 percent, and the top 5 percent, respectively. The disparity means income inequality increased in 2011. 
  • $7,887, -12.4%: The decline in median working-age household income from 2000 to 2011 in level terms and percentage terms, respectively 
  • $6,518, -16.8%: The decline in median African-American household income from 2000 to 2011 in level terms and percentage terms, respectively 
  • $4,695, -10.8%: The decline in median Hispanic household income from 2000 to 2011 in level terms and percentage terms, respectively 
  • $50,622, $48,202:  Median earnings for a man working fulltime, full year in 1973 and 2011, respectively 
  • $28,699, $37,118:  Median earnings for a female working fulltime, full year in 1973 and 2011, respectively
Putting the Census numbers in the context of public policy in their new report, EPI explains how economic policies, including policymakers’ actions and failures to act, have continuously undercut the ability of workers to benefit from economic growth in the United States. Its primary findings include:
  • America’s vast middle class has suffered a “lost decade” and faces the threat of another. The wages of typical Americans, including college graduates, are lower today than they have been in over a decade. Because hourly wages and compensation failed to grow after the 2001 recession, household incomes had declined even before the Great Recession. Furthermore, forecasts of high unemployment for many years ahead suggest that another lost decade for typical American workers and their families, as measured by wages and income, has already begun.
  • Income and wage inequality have risen sharply over the last 30 years. Income inequality has grown sharply since 1979, a fact that is universally recognized by researchers. The trends that have driven this growing inequality in overall incomes are growing concentration of both capital income (the returns to financial assets) and labor income (wages and benefits), as well as a shift from labor income toward capital income.
  • Rising inequality is the major cause of wage stagnation for workers and of the failure of low- and middle-income families to appropriately benefit from growth. The typical worker has not benefited from productivity growth since 1979, though there has been sufficient economic growth to provide a substantial across-the-board increase in living standards. Instead, higher earners have reaped a disproportionate share of wage income, and the top one percent of households have received a disproportionate share of all income growth. Aside from the period of strong growth in the late-1990s, wages for low-and middle-wage workers were stagnant from 1979 to 2007, and incomes for lower- and middle-class households grew slowly.
  • Economic policies caused increased inequality of wages and incomes. Inequality between the very top wage earners and all others grew from 1979 to 2011 except during stock declines, driven by growing executive compensation and an expanded and increasingly highly-paid financial sector. Inequality between the top wage earners and middle-wage earners also grew from 1979 to 2011. A number of policies played a role in this growth, including those that: (1) targeted rates of unemployment too high to provide reliably tight labor markets for low- and middle-wage workers; (2) hastened global integration of the U.S. economy without protecting U.S. workers; (3) failed to manage destructive international trade imbalances; (4) allowed employer practices hostile to unions to flourish; (5) privatized and deregulated industry, including the financial sector; and (6) eroded labor standards. Inequality between middle-wage earners and the lowest wage earners grew only in the 1980s, fueled by the erosion of the purchasing power of the minimum wage and, again, the targeting of rates of unemployment that were too high. Tax and budget policies have compounded the inequalities that have been generated in market-based, pre-tax incomes.
  • Claims that growing inequality has not hurt middle-income families are flawed. Some recent studies have suggested that measures of comprehensive income since 1979 show that middle-income families have seen adequate income growth. Rather, incomes for the middle class have not grown as fast as average incomes, and middle-income growth was much slower between 1979 and 2007 than it was between 1947 and 1979. Furthermore, more than half of the income growth between 1979 and 2007 was made up of government transfers, which reflects the strength of programs like Social Security, Medicare and Medicaid, not the strength of the labor market. In fact, higher household labor earnings can be traced to increasing work hours, not higher wages. Finally, the data on comprehensive incomes are technically flawed because they count rapidly rising health expenditures made on behalf of households by employers and the government as income, without taking excessive health care inflation into account.
  • Growing income inequality has not been offset by increased mobility. There is no evidence that mobility—changes in economic status from one generation to the next—has increased to offset rising inequality, and some research shows a decline.
  • Inequalities persist by race and gender. Key economic measures, including unemployment, wealth, and poverty (particularly child poverty), continue to show staggering disparities by race and ethnicity. Gender disparities also persist, and while gaps in labor market outcomes have closed in recent decades, a number have done so because men lost ground, not because women gained it.
“The State of Working America, 12th Edition” includes new and compelling data on:
Income
  • the components of the Congressional Budget Office’s “comprehensive income” growth for the middle class (health care insurance, wages, pensions, work hours, government benefits)
  • the growth of capital income by income group and the growing concentration of capital incomes
Mobility
  • the stagnation of economic mobility
  • the poor performance of the U.S. economy in international rankings of mobility
Wages
  • flat or falling wages for college graduates in almost every occupation over the past 10 years
  • wage trends by education, decile, gender, and race/ethnicity
  • the growth of wage inequality for the three key wage gaps: between the top one percent and others, between the top and middle (95/50 wage gap), and between the middle and bottom (50/10 wage gap)
  • the impact of rising health care costs on wage growth and wage inequality
  • the factors driving the gap between productivity and median hourly compensation growth
  • the role of the financial sector and CEO compensation in fueling the top one percent’s income growth
Jobs
  • the extent to which changes in the labor force participation rate are due to the weak economy or are structural/demographic
  • why current unemployment is cyclical and not structural
Wealth
  • the decline of median wealth between 1983 and 2010 (while wealth at the top grew strongly)
  • the collapse of wealth in African American and Hispanic households
  • the role of housing equity’s collapse on middle class wealth
  • the increasing concentration of stock ownership
Poverty
  • the factors driving high poverty and low-end wages
  • the large role income inequality plays in growing poverty (as opposed to demographic factors like family formation)
  • the contribution of longer work hours to low-income families’ income
  • the relatively small role tax and transfer policy plays in reducing poverty in the U.S. in comparison to peer countries
  • high child poverty rates in comparison to peer countries

Friday, May 11, 2012

What Kind of Society Do Americans Want?

by LAWRENCE DAVIDSON
 
On 7 May 2012 a new study came out on healthcare in the United States. Based on research carried out by the Urban Institute, the report is published in the journal Health Affairs. Here are some of its findings:
  • There is a prevailing “trend toward private insurance policies with larger deductibles and higher co-payments…”
  • “Employers [are] shifting more [heath care] costs onto workers.”
  • “Poor and uninsured adults [there are presently 41 million such people in the U.S.] had greater difficulties not just with health care costs, but finding doctors who would see them.” In addition, “too few providers are taking Medicaid” patients.
  • One consequence of this trend is that “one in five American adults under 65 had an ‘unmet medical need’ because of costs in 2010, compared with one in eight in 2000.”
What all this means is that health care in the U.S. has deteriorated in the first decade of the 21st century. That was also reflected in a 2005 study by the World Health Organization that ranked the United States (supposedly the richest of nations) as 141st in government spending on health. Perhaps not unrelated, the U.S. ranks number 1 in the world when it comes to anxiety disorders.

The Philosophy Behind the Decline
This situation reflects a culture-shaping philosophy that has persisted in this country, with but brief interludes, since its founding. That philosophy teaches that we all are, or should be, rugged individuals. We should take care of ourselves and not rely on others. That is our responsibility in life and if someone can not measure up its their problem, not society’s.

Where does this attitude come from? There are no doubt multiple roots, but one source is an historically deep-seated national dislike of taxation. From the first moment of revolution against Great Britain, freedom meant escaping imperial taxes. Americans of that day claimed that only elected local legislatures could rightly lay down taxes. The claim was made, in part, because within such a localized system taxes could be kept to an absolute minimum.

This attitude toward taxation is, in turn, at the heart of the original capitalist outlook as it evolved in the 18th century. According to this perspective there are only three things for which the government can rightly tax its citizens: national defense, internal security (including the court system) and the enforcement of contracts. Beyond that the government must leave people alone and that includes not “over taxing” them and not regulating any of their business affairs.

This philosophy has caused untold misery since its inception. For the first century of the industrial revolution when the government of Great Britain (the original industrializing nation) was controlled by people who wanted minimal taxation and no business regulation, working class people lived in dire poverty, environmental pollution was rampant, industrial safety was non-existent, and health care for the poor was the concern of private charity only. Why? Because for the government to address any of these concerns would cost money and that would mean raising the taxes of the folks who had money.

It took over one hundred years of labor organizing, strikes, riots, outbreaks of preventable diseases, and the incessant pestering of elected officials by that small minority of the population who thought all this was a scandal (mostly women and religious folks), to force politicians (kicking and screaming) to address social needs and enforce health and safety related regulations. The Great Depression beginning in 1929 forced the issue with a vengeance and led to larger government and the “welfare state.” In other words, it led to a sense of social responsibility on the part of Western governments–most reluctantly the U.S. government. In America, that lasted through the 1970s and then the situation reversed.

One would think that memory would serve us for more than a mere forty odd years. That after suffering all the misery brought on by 19th and early 20th century capitalism we would have learned that to achieve social peace and a modicum of general prosperity, the government must perform important community functions including supplying all its citizens with decent and affordable health care.

But no it hasn’t worked that way. In 1981 Ronald Reagan became president. He started the process of deregulation and shifting taxation away from the rich. Others, including Democrats like Bill Clinton, followed along. When recently Barack Obama proposed health care reform he was labeled a socialist. Now, just listen to Mitt Romney and his Republican cohorts. Just listen to the Tea Party cabal. Just listen to Fox News. All of them want to go back to the “good old days” of minimalist government and minimum taxes. By the way, in the midst of those good old days, about the year 1843, the median age of death in the industrial city of Manchester England was 17.

What Kind of Society Do Americans Want?
This leads us to the question, just what sort of society do Americans want? Indeed, do they want a meaningful society at all?. Why not just stick to family units or small tribes drifting about in a state of nature? Well, in a sense that is what we chose to do. The tribes have become larger and today we call them nation states. But in the American version, localism makes for myriad sub-tribes. In the state of Pennsylvania, where I live, the people in the relatively rural center of the state as well as those in the urban suburbs, not only care little for those living in cities such as Philadelphia and Pittsburgh, they actively dislike them. They don’t feel like they live in the same society. And they certainly don’t want to be taxed to help an urban population with a lot of poor folks. In others words, whatever sense of social solidarity rural and suburban Pennsylvanians feel, it does not go much beyond their own local community (or “tribe”). And Pennsylvanians are by no means unique in this country

The fact is that, in terms of social conscience, the U.S. is still quite a primitive place. And this primitiveness is sustained by a philosophy of selfishness. Among other things, that prevailing philosophy is making an ever greater number of us unhealthy. Is this acceptable to most Americans? Is that the kind of society they want? The political practice since 1981 seems to answer, yes.

Thursday, February 2, 2012

The Health Care Racket

Follow the Bills
by RALPH NADER

Looking at millions of individual bills that makeup the 2.7 trillion dollars of annual health care costs opens a gigantic window on the massive waste, redundancy, profiteering, fraud and sometimes criminal over-billing.

Here is a partial example of what I mean, in the words of Philip M. Boffey, the estimable science writer for the New York Times:

“Why does an appendectomy in Germany cost roughly a quarter what it costs in the United States? ($3,285 compared to $13,123). Or an MRI scan cost less than a third as much, on average, in Canada? ($304 compared to $1,009).
“Americans continue to spend more on health care than patients anywhere else. In 2009, we spent $7,960 per person, twice as much as France, which is known for providing very good health services. And for all that spending, we get very mixed results—some superb, some average, some inferior—compared with other advanced nations.”

Moreover, France and Germany, Italy, England, Canada, Belgium, Sweden and all other western countries plus Japan and Taiwan cover almost all their citizens, unlike the U.S. where 50,000,000 people are uninsured.

Boffey, who wrote a book on the National Academy of Sciences, (The Brain Bank of America: An Inquiry into the Politics of Science), under our sponsorship in 1975 goes on to cite the comparative price report of the International Federation of Health Plans in 2010. They are stunning! For Britain, Canada, France, Germany and the U.S. respectively, the average cost in dollars for bypass surgery is $13,998, $22,212, $16,325, $27,237 and in the U.S. $59,770. For cataract surgery the bill is $1,299, $927, $3,352, N.A. and in the U.S. $14,764.

Boffey adds other explanatory factors. These include higher administrative costs to deal with insurance paperwork, higher insurance company profits and executive compensation and less developed electronic health records leading to costly errors.

Except for Germany there are somewhat longer waiting times for some patients to see a specialist in these countries. But in the U.S. seeing specialists is often prohibitively expensive, and if you cannot afford such services, that is the longest waiting time of all.

A recent commentary in the Mayo Clinic Proceedings last August by Charles. W. Slack and Warner V. Slack, MD suggests another compelling comparison—between outcomes in different states in the U.S. They ask “why, for example, do Mississippi, Louisiana, and Georgia have such a high rate of mortality amenable to health care when compared with Idaho, Oregon and Washington.” Wide differences between states and counties have been documented regarding the cost of identical operations, frequency of operations such as cesarean sections or hysterectomies and other surgical disparities studied under controlled variables.

Health care bills come with hefty levels of fraud. From the historic study twenty years ago by the then General Accounting Office of the Congress to the present estimates by the nation’s leading expert in this field, Professor Malcolm Sparrow at Harvard University, fully ten percent of all health care expenditures are the result of computerized billing fraud and abuse. That will be $270 billion this year.

Dr. Sparrow, an applied mathematician, says it could be higher if the federal government would simply do a more detailed study. He adds that the enforcement budget should be one percent of the estimable volume of fraud. In actual practice, the enforcement budget is less than one/tenth of one percent, even though every dollar of enforcement brings in at least seventeen dollars back. (See Dr. Sparrow’s website: http://www.hks.harvard.edu/fs/msparrow/ )

Obviously the corporate fraud lobby is stronger than the taxpayer/consumer lobby in Washington, D.C. But why the health insurance companies, a formidable force in their own right when it comes to protecting its turf against single payer or full Medicare insurance (see singlepayeraction.org) do not do more to stop fraudulent billing practices, is a puzzle.

All in all, the health care industry is replete with rackets that neither honest practitioners or regulators find worrisome enough to effectively challenge. The perverse economic incentives in this industry range from third party payments to third party procedures. Add paid-off members of Congress who starve enforcement budgets and the enormous profits that comes from that tired triad “waste, fraud and abuse” and you have a massive problem needing a massive solution.

So, voters, why not start challenging all candidates for elective office to make this vast daily heist a front burner campaign issue.

Tuesday, June 21, 2011

$1 Bank Robbery

06.20.11
by Abby Zimet


Pity James Richard Verone, 59, an unemployed, otherwise law-abiding guy who robbed a North Carolina bank of $1 so he could get arrested and get health care for several ailments. It should be a John Prine song; instead, it's America today.