by Robert Oak | The Economic Populist
The BLS employment report shows the official (U3) unemployment rate ticked down 0.1 percentage point to 7.6%, but not because people gained employment. Instead the unemployment rate dropped due to less people participating in the labor market. The labor participation rate just hit a record low, not seen since May 1979 when many segments of the population was still quite discriminated against in the workforce. One cannot just blame retiring baby boomers for low labor participation rates This article overviews and graphs the statistics from the Current Population Survey of the employment report. Below is a graph of the official unemployment rate.
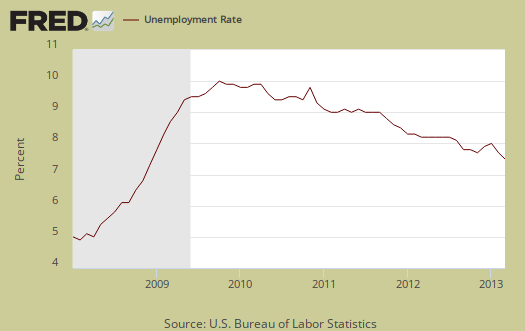
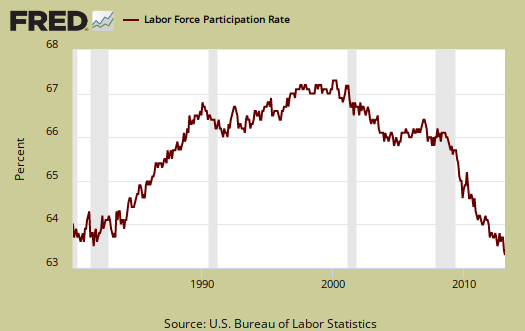
The labor participation rate dropped 0.2 percentage points to 63.3%, mentioned above.
The labor participation rate is at artificial lows, where people needing a job are not being counted. A drop isn't good actually for it means that those who dropped out of the labor force are staying out of the labor force. For those claiming the low labor participation rate is just people retired, we proved that false by analyzing labor participation rates by age.
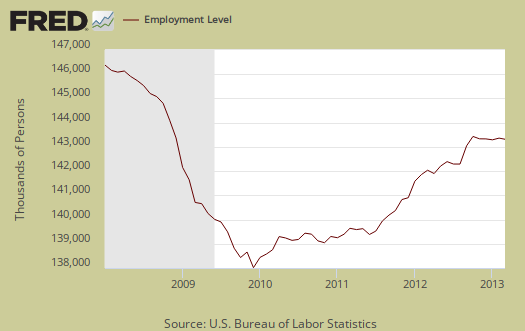
The number of employed people now numbers 143,286,000, a -206,000 monthly decline. We describe here why you shouldn't use the CPS figures on a month to month basis to determine actual job growth. These are people employed not actual jobs. In terms of labor flows, the employed has been static for the last six months, a decline of 42,000 employed since October 2012. From a year ago the employed have risen 1.266 million, but bear in mind the noninstitutional population has also increased by 2.391 million during the same time period. The statistics from the CPS generally vary widely from month to month. Below is a graph of the Current Population Survey employed.
Those unemployed stands at 11,742,000, a decline of -290,000 from last month. Below is the change in unemployed and as we can see, this number also swings wildly on a month to month basis.
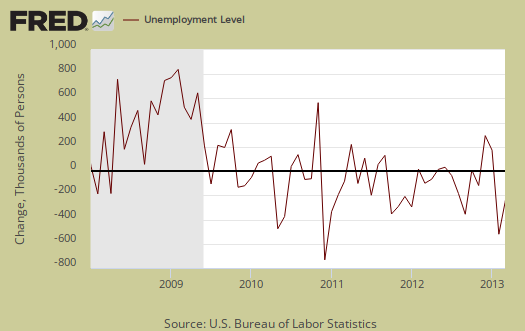
The number of people counted as unemployed has also remained fairly static. From a year ago the official unemployed as declined by -944,000. , For the last six months, the unemployed has dropped by -506 thousand people. Yet from the employed levels we can see these people are going into not in the labor force instead of getting a job. Below is a graph of the unemployed.
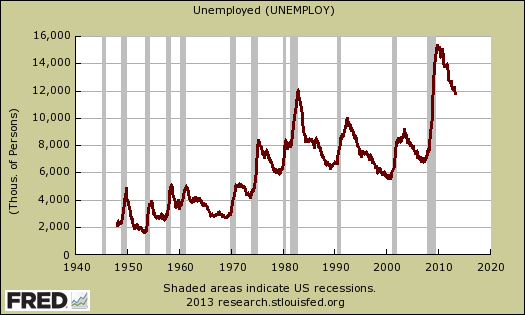
We want to show a historical graph of the unemployed going back to 1948. This is just ridiculous. The number of official unemployed stands at 11,742,000. In November 1982, the unemployed was 11,938,000. That is over 30 years ago, during the 1980-1982 recession, and the civilian noninstitutional population has increased by 76.3 million people since then. Congratulations America, over five years past the official end of the recession the jobs crisis is still worse than it was during the height of the 1980-1982 recession.
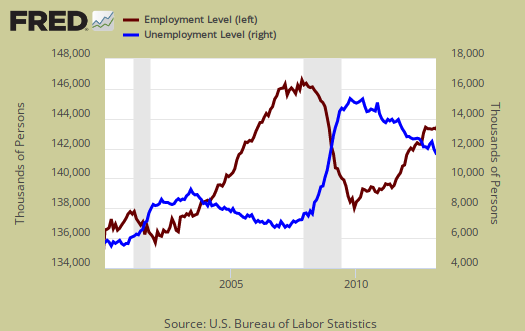
Below is a graph of those considered employed, in maroon, scale on left, against those considered unemployed, in blue, scale on right, by the BLS methods. It is only recently that the growth rate of the employed has exceeded the growth rate of the unemployed (the maroon line exceeding the blue line).
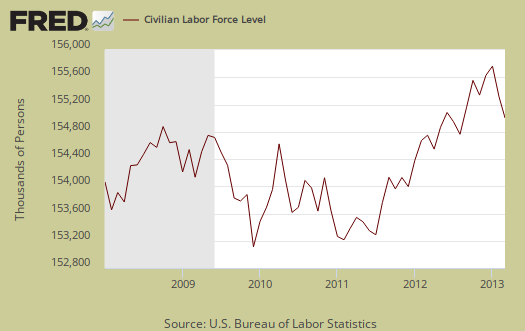
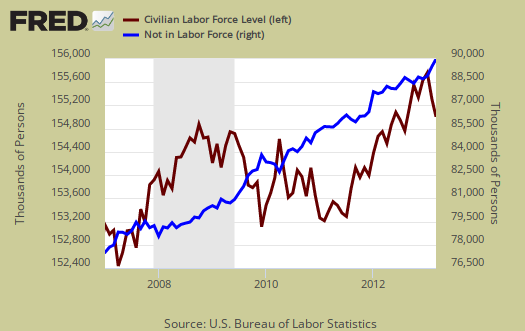
The civilian labor force, which consists of the employed and the officially unemployed, is now at 155,028,000. This is a decline of -496 thousand from last month. Notice in the graph below how many more people are in the labor force than at the start of the 2008 recession. Population increases every month and this post gives details on that increase, while this one describes BLS labor concepts as well as how many jobs are needed just to keep up with the increased population (.
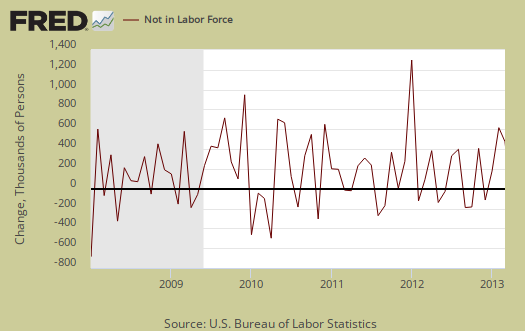
It's fairly clear the American workforce is ending up in the not counted statistics. Those not in the labor force now tallies to 89,967,000, an increase of 663,000 from last month. Below is the change to show on a month to month basis, the CPS shows quite a bit of variance. We talk about the wild monthly CPS changes in this post.
Below is a graph of the civilian labor force, in maroon, scale on left, against those not in the labor force, in blue, scale on right. Notice how those not in the labor force as a trend exceeds those considered employed and unemployed. What we see is a never ending growing segment of the population that is considered neither employed or unemployed, i.e. not in the labor force, increasing, above the trend line of those who would be naturally dropping out, such as the retired and those in school. This is the god awful, terrible aspect of this report. Once again we see a huge segment of the U.S. population that could be working or looking for work laying idle. Not in the labor force does include retirees, yet clearly 663 thousand baby boomers did not just magically retiree in a month.
Those considered employed as a ratio to the total Civilian noninstitutional population stands at 58.5%, a -0.1 percentage point drop from last month. This ratio hasn't been this low since August 1980, as shown in the graph below. This implies there are many people who could be part of the labor force who are not anymore.

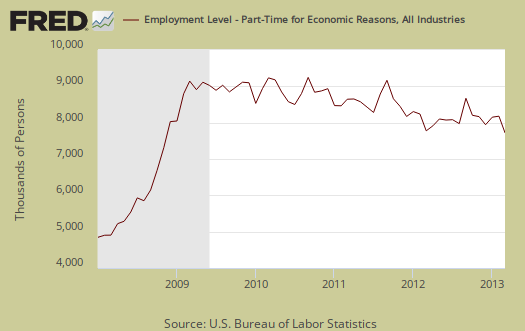
A huge problem with today's labor market is the gross number of working part-time generally. There are a huge number of people who need full-time jobs with benefits who can't get decent career oriented positions. Those forced into part time work is now 7,638,000, and drop of -350,000 from last month. While still a hell of a lot of people are stuck with part-time hours who need full-time work, this is the best news of this month's unemployment report. With less people working part-time, eventually businesses should have to hire additional workers (unless of course they offshore outsource to China and India).
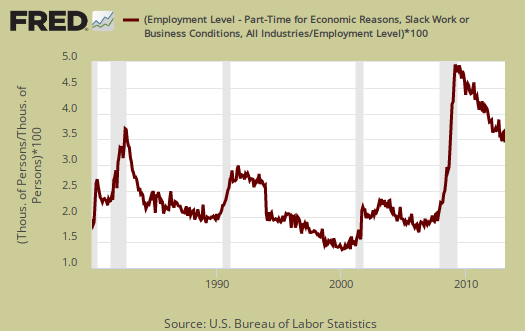
Below is a graph of forced into part-time work because they got their hours cut, graphed as a percentage of the total employed. Part-time due to cut hours is known as slack work conditions and consisted of 4,906,000 people for March. This is a decline of -230,000 from last month. Below is a graph of forced part-timers due to slack work conditions as a percentage of the civilian labor force. We think this graph is a recession economic indicator, and notice the slope matches strongly the gray recession bars of the graph. The percentage of people in working part-time due to slack economic conditions has stayed extremely high since the start of the Great Recession, even though it is overall clearly on a downward trend.
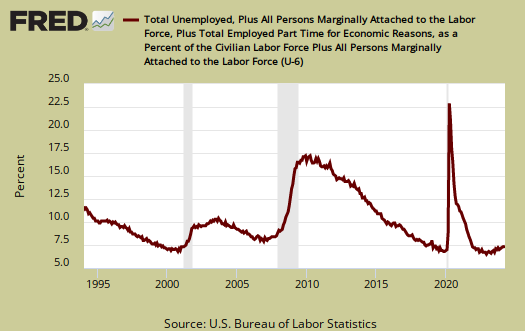
U-6 is a broader measure of unemployment and includes the official unemployed, people working part-time hours because that's all they can get and a subgroup not counted in the labor force but are available for work and looked in the last 12 months. Believe this or not, the U-6 alternative unemployment rate still leaves out some people wanting a job who are not considered part of the labor force. U-6 declined a whopping -0.5 percentage points to 13.8%. The reason for the massive drop in U-6 are the declines in part-timers shown above.
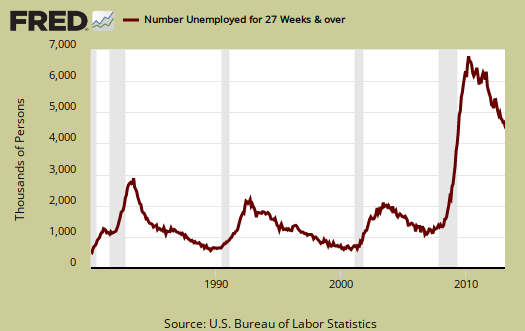
The long term unemployed, or those unemployed for 27 weeks and over, stand at 4,611,000 people. This is a decline of -186 thousand from last month. The long term unemployed are the crisis of our time and this figure just isn't decreasing and they are getting hired. The long term unemployed are now 39.6% of the total unemployed and this percentage decreased -0.6 percentage points from last month. Because we see such an increase in those not in the labor force, odds are we just saw more long term unemployed drop off the unemployed statistics radar instead of actually getting a job. Behind this figure is economic devastation for 4.6 million people.
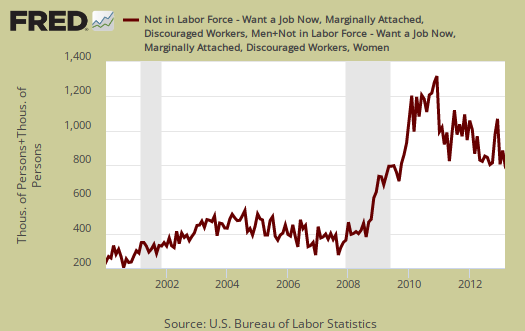
The marginally attached are people not in the labor force because they have not looked for a job in the last month, but have looked for a job in the last year. This number has ballooned since 2007 and not returned to pre-recession levels. The graph below is the number of people considered marginally attached to the labor force, currently at 2.326 million.

Discouraged workers are people, not counted as part of the civilian labor force, who not only want a job, but also looked for one in the last year. These people aren't job hunting now because they believe there are no jobs out there. Below is the graph of discouraged workers, currently at 803 thousand people and are a subset of the marginally attached. Discouraged workers is kind of a baramoter for how the job market is perceived.
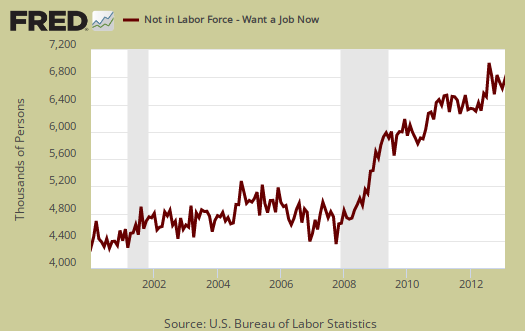
One of our favorite statistics from the CPS survey is how many people who are considered not in the labor force, want a job now. It is a direct survey question from the CPS. The survey asks people who are not being counted in the unemployment statistics and official unemployment rate if they want a job. The number who answer yes currently stands at 6,722,000. This is a 101 thousand person decrease from last month. That's an astounding number of people not counted who report they actually want a job and roughly 2 million higher than before the recession. This figure includes the discouraged workers and marginally attached, but is seasonally adjusted, unlike the above.
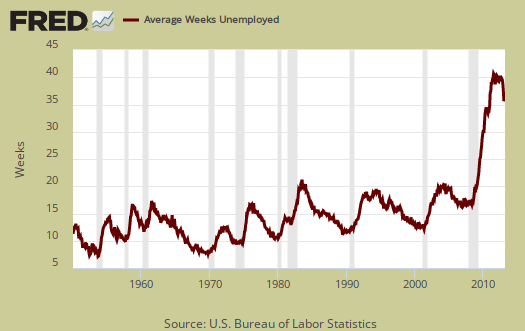
The average length of unemployment is now 37.1 weeks, an increase of 0.2 weeks from last month. This still is an absurdly long amount of time to be unemployed and has stayed highly elevated for years, an uptick is not what we want to see.
The average duration is also so high due to the long-term unemployed, who clearly are having a hell of a time getting a job, many facing age discrimination.
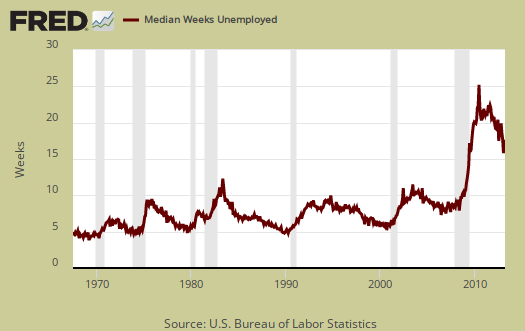
The median time one is unemployed, which means 50% of people have gotten a job in this amount of time, and is 18.1 weeks, an increase of 0.3 weeks from last month..
Those unemployed less than five weeks dropped by -203 thousand, those unemployed between five weeks and 14 weeks increased by 56 thousand and people who had been unemployed for 14 weeks to 26 weeks also increased 42,000. As previously noted, the long term unemployed dropped by -203 thousand. Yet do not let the decline in short and long term unemployed fool you into thinking the job market is picking up from these duration figures. A drop in the unemployed does not necessarily mean they found a job.
The BLS employment report shows the official (U3) unemployment rate ticked down 0.1 percentage point to 7.6%, but not because people gained employment. Instead the unemployment rate dropped due to less people participating in the labor market. The labor participation rate just hit a record low, not seen since May 1979 when many segments of the population was still quite discriminated against in the workforce. One cannot just blame retiring baby boomers for low labor participation rates This article overviews and graphs the statistics from the Current Population Survey of the employment report. Below is a graph of the official unemployment rate.
The labor participation rate dropped 0.2 percentage points to 63.3%, mentioned above.
The labor participation rate is at artificial lows, where people needing a job are not being counted. A drop isn't good actually for it means that those who dropped out of the labor force are staying out of the labor force. For those claiming the low labor participation rate is just people retired, we proved that false by analyzing labor participation rates by age.
The number of employed people now numbers 143,286,000, a -206,000 monthly decline. We describe here why you shouldn't use the CPS figures on a month to month basis to determine actual job growth. These are people employed not actual jobs. In terms of labor flows, the employed has been static for the last six months, a decline of 42,000 employed since October 2012. From a year ago the employed have risen 1.266 million, but bear in mind the noninstitutional population has also increased by 2.391 million during the same time period. The statistics from the CPS generally vary widely from month to month. Below is a graph of the Current Population Survey employed.
Those unemployed stands at 11,742,000, a decline of -290,000 from last month. Below is the change in unemployed and as we can see, this number also swings wildly on a month to month basis.
The number of people counted as unemployed has also remained fairly static. From a year ago the official unemployed as declined by -944,000. , For the last six months, the unemployed has dropped by -506 thousand people. Yet from the employed levels we can see these people are going into not in the labor force instead of getting a job. Below is a graph of the unemployed.
We want to show a historical graph of the unemployed going back to 1948. This is just ridiculous. The number of official unemployed stands at 11,742,000. In November 1982, the unemployed was 11,938,000. That is over 30 years ago, during the 1980-1982 recession, and the civilian noninstitutional population has increased by 76.3 million people since then. Congratulations America, over five years past the official end of the recession the jobs crisis is still worse than it was during the height of the 1980-1982 recession.
Below is a graph of those considered employed, in maroon, scale on left, against those considered unemployed, in blue, scale on right, by the BLS methods. It is only recently that the growth rate of the employed has exceeded the growth rate of the unemployed (the maroon line exceeding the blue line).
The civilian labor force, which consists of the employed and the officially unemployed, is now at 155,028,000. This is a decline of -496 thousand from last month. Notice in the graph below how many more people are in the labor force than at the start of the 2008 recession. Population increases every month and this post gives details on that increase, while this one describes BLS labor concepts as well as how many jobs are needed just to keep up with the increased population (.
It's fairly clear the American workforce is ending up in the not counted statistics. Those not in the labor force now tallies to 89,967,000, an increase of 663,000 from last month. Below is the change to show on a month to month basis, the CPS shows quite a bit of variance. We talk about the wild monthly CPS changes in this post.
Below is a graph of the civilian labor force, in maroon, scale on left, against those not in the labor force, in blue, scale on right. Notice how those not in the labor force as a trend exceeds those considered employed and unemployed. What we see is a never ending growing segment of the population that is considered neither employed or unemployed, i.e. not in the labor force, increasing, above the trend line of those who would be naturally dropping out, such as the retired and those in school. This is the god awful, terrible aspect of this report. Once again we see a huge segment of the U.S. population that could be working or looking for work laying idle. Not in the labor force does include retirees, yet clearly 663 thousand baby boomers did not just magically retiree in a month.
Those considered employed as a ratio to the total Civilian noninstitutional population stands at 58.5%, a -0.1 percentage point drop from last month. This ratio hasn't been this low since August 1980, as shown in the graph below. This implies there are many people who could be part of the labor force who are not anymore.
A huge problem with today's labor market is the gross number of working part-time generally. There are a huge number of people who need full-time jobs with benefits who can't get decent career oriented positions. Those forced into part time work is now 7,638,000, and drop of -350,000 from last month. While still a hell of a lot of people are stuck with part-time hours who need full-time work, this is the best news of this month's unemployment report. With less people working part-time, eventually businesses should have to hire additional workers (unless of course they offshore outsource to China and India).
Below is a graph of forced into part-time work because they got their hours cut, graphed as a percentage of the total employed. Part-time due to cut hours is known as slack work conditions and consisted of 4,906,000 people for March. This is a decline of -230,000 from last month. Below is a graph of forced part-timers due to slack work conditions as a percentage of the civilian labor force. We think this graph is a recession economic indicator, and notice the slope matches strongly the gray recession bars of the graph. The percentage of people in working part-time due to slack economic conditions has stayed extremely high since the start of the Great Recession, even though it is overall clearly on a downward trend.
U-6 is a broader measure of unemployment and includes the official unemployed, people working part-time hours because that's all they can get and a subgroup not counted in the labor force but are available for work and looked in the last 12 months. Believe this or not, the U-6 alternative unemployment rate still leaves out some people wanting a job who are not considered part of the labor force. U-6 declined a whopping -0.5 percentage points to 13.8%. The reason for the massive drop in U-6 are the declines in part-timers shown above.
The long term unemployed, or those unemployed for 27 weeks and over, stand at 4,611,000 people. This is a decline of -186 thousand from last month. The long term unemployed are the crisis of our time and this figure just isn't decreasing and they are getting hired. The long term unemployed are now 39.6% of the total unemployed and this percentage decreased -0.6 percentage points from last month. Because we see such an increase in those not in the labor force, odds are we just saw more long term unemployed drop off the unemployed statistics radar instead of actually getting a job. Behind this figure is economic devastation for 4.6 million people.
The marginally attached are people not in the labor force because they have not looked for a job in the last month, but have looked for a job in the last year. This number has ballooned since 2007 and not returned to pre-recession levels. The graph below is the number of people considered marginally attached to the labor force, currently at 2.326 million.
Discouraged workers are people, not counted as part of the civilian labor force, who not only want a job, but also looked for one in the last year. These people aren't job hunting now because they believe there are no jobs out there. Below is the graph of discouraged workers, currently at 803 thousand people and are a subset of the marginally attached. Discouraged workers is kind of a baramoter for how the job market is perceived.
One of our favorite statistics from the CPS survey is how many people who are considered not in the labor force, want a job now. It is a direct survey question from the CPS. The survey asks people who are not being counted in the unemployment statistics and official unemployment rate if they want a job. The number who answer yes currently stands at 6,722,000. This is a 101 thousand person decrease from last month. That's an astounding number of people not counted who report they actually want a job and roughly 2 million higher than before the recession. This figure includes the discouraged workers and marginally attached, but is seasonally adjusted, unlike the above.
The average length of unemployment is now 37.1 weeks, an increase of 0.2 weeks from last month. This still is an absurdly long amount of time to be unemployed and has stayed highly elevated for years, an uptick is not what we want to see.
The average duration is also so high due to the long-term unemployed, who clearly are having a hell of a time getting a job, many facing age discrimination.
The median time one is unemployed, which means 50% of people have gotten a job in this amount of time, and is 18.1 weeks, an increase of 0.3 weeks from last month..
Those unemployed less than five weeks dropped by -203 thousand, those unemployed between five weeks and 14 weeks increased by 56 thousand and people who had been unemployed for 14 weeks to 26 weeks also increased 42,000. As previously noted, the long term unemployed dropped by -203 thousand. Yet do not let the decline in short and long term unemployed fool you into thinking the job market is picking up from these duration figures. A drop in the unemployed does not necessarily mean they found a job.
No comments:
Post a Comment