Friday, January 17, 2014

A Nation of Moochers and Potheads...To Be Spied Upon Forever


A Eulogy for the Fourth Amendment

Even the Obama's Fans Aren't Pretending that was a Good Speech
by DAVID SWANSON


President Barack Obama
gave a eulogy for the Fourth Amendment on Friday, and not even his fans are proclaiming victory. In this moment when Obama is actually doing one thing I agree with (talking to Iran), more and more people seem to be slowly, agonizingly slowly, finally, finally, finally, recognizing what a complete huckster he is when it comes to pretty speeches about his crimes.

Obama’s speech and new “policy directive” eliminate the Fourth Amendment. Massive bulk collection of everybody’s data will continue unconstitutionally, but Obama has expressed a certain vague desire to end it, sort of, except for the parts that are needed, but not to do so right away. The comparisons to the closure of the Guantanamo death camp began instantly.

Far from halting or apologizing for the abuses of the NSA, Obama defends them as necessitated by the danger of a new 911. While drones over Yemen and troops in Afghanistan and “special” forces in three-quarters of the world are widely understood to endanger us, and while alternatives that upheld the rule of law and made us safer would not require secrecy or human rights violations, Obama wants to continue the counterproductive and immoral militarism while holding off all blowback through the omniscience of Big Brother.

However, Obama’s own panel and every other panel that has looked into it found zero evidence that the new abusive NSA programs have prevented any violent attacks. And it is well-documented that (even given the disastrous policies that produced 911) the attacks of that day could have been stopped at the last minute by sharing existing data or responding to urgent memos to the president with any sort of serious effort.

Obama has not proposed to end abuses.
He’s proposed to appoint two new bureaucrats plus John Podesta. Out of this speech we get reviews of policies, a commitment to tell the Director of National Intelligence to read court rulings that impact the crimes and abuses he’s engaged in, and a promise that the “Intelligence Community” will inspect itself. (Congress, the courts, and the people don’t come up in this list of reforms.) Usually this sort of imperial-presidential fluff wins praise from Obama’s followers. This time, I’m not hearing it.

True, after EFF created a great pre-speech scorecard, when Obama scored a big fat zero, EFF said it was encouraged that he might score a point some day. But they didn’t sound impassioned about their encoragement.

Obama’s promises not to abuse unchecked secret powers (and implied promise that none of his successors or subordinates will abuse them either) is not credible, or acceptable, while it just might be impeachable. We’re talking here about the same government that listens in on soldiers’ phone sex, Congress members’ daily lives, and everything it can get its hands on related to the actual, rather than rhetorical, promotion of liberty, justice, or peace. A report today quotes various members of the government with security clearance who want to murder Edward Snowden. We’re supposed to just trust them with the right to or persons, houses, papers, and effects without probably cause or warrant? Are we also to trust the corporations they ask to do their dirty work, should the theoretical future reform of this outrage involve paying corporations to own our info?

Obama claims the “debate” — in which no debate opponent was given a minute at the microphone — is valuable. But the whistleblowers who create such debates “endanger” us, Obama says. This he claims without evidence.
If the debate was so useful, why not give the man who made you hold it with yourself his passport back?

Obama began Friday’s speech with a Sarah Palinesque bit of Paul Revere history. Revere is now an honorary NSA spy. In reality, the British would have hit Revere with a hellfire missile if Obama had been their king. It all depends on which side of a war you imagine someone to be on, and on whether you imagine war itself is an acceptable form of human behavior at this late date. Without the endless war on the world, the need for secrecy would go away, and with it the powers that secrecy bestows, and with them the arrogant speeches by rulers who clearly hold us all in contempt.

Resisters of royalty came up with a cure back in Paul Revere’s day. They called it impeachment. Of course it would be highly inappropriate to use. It might get in the way of the Fight for Freedom.

Obama’s Numbers (January 2014 Update - FactCheck.org)

Latest statistics show stagnant wages, persistent long-term joblessness, soaring profits and stock prices, and moderating health care spending.
January 15, 2014 / FACTCHECK.org

Summary

As we do every three months, we are updating our “Obama’s Numbers” report with fresh statistics reflecting what has happened since the president first took office.

Some highlights from this round:

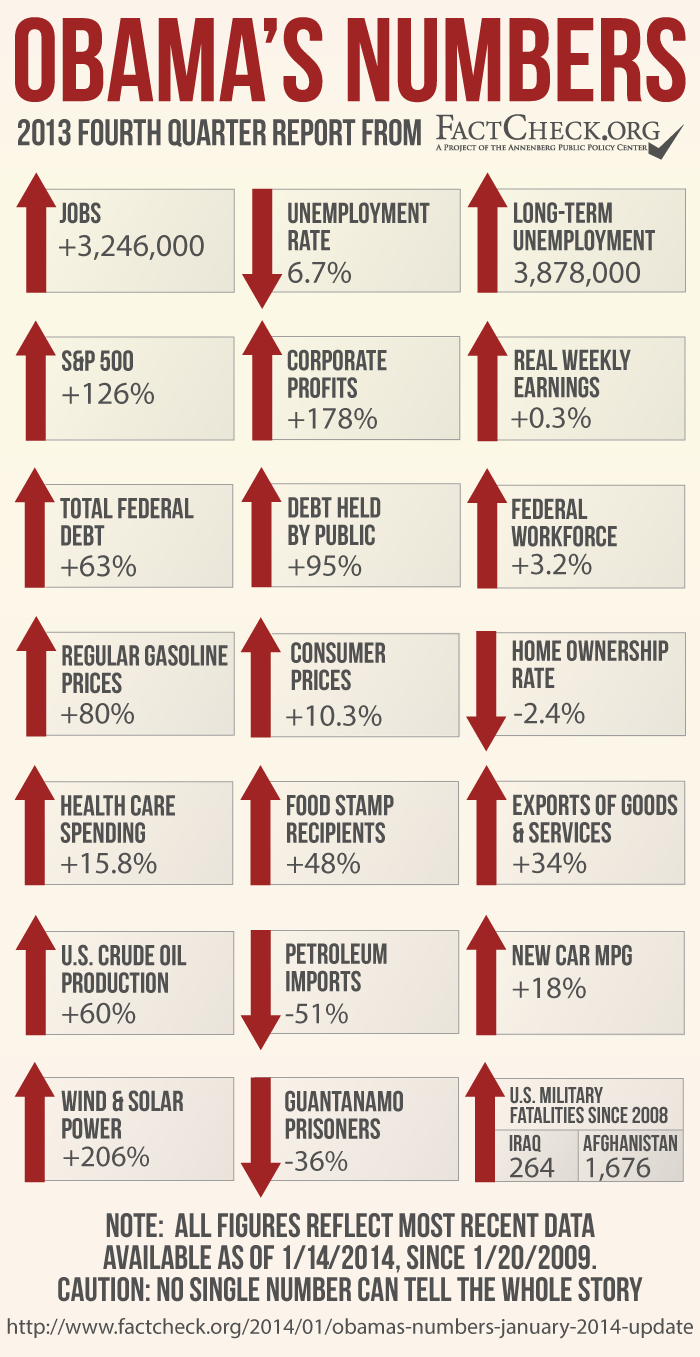
The economy continues to gain jobs, but the number of long-term unemployed is nearly double what it was when Obama became president.

Wages remain stagnant,
increasing a scant 0.3 percent after inflation during Obama’s time. Meanwhile corporate profits are running 178 percent higher than just before he took office, and stock prices have doubled.

The number of low-income persons on food stamps remains just below the record level reached in 2012, with 15 percent of the population still getting benefits.

Health care spending has increased 15.8 percent under Obama, which is faster than inflation but modest by historical standards. But there’s scant evidence that the Affordable Care Act is causing the slowdown. The government economists and statisticians who track the spending said the law’s impact has been “minimal.”

U.S. exports have gone up just 34 percent — leaving the president far short of his announced goal of doubling them by the end of this year.

The number of suspected terrorists held prisoner at Guantanamo — which the president once ordered closed by January 2010 — is down only 36 percent.

The federal debt owed to the public has nearly doubled since Obama was sworn in, increasing by 95 percent.


Analysis

This report follows our October 2013 update and previous quarterly reports dating back to our first “Obama’s Numbers” article in October 2012. All figures here reflect the most recent available as of Jan. 14.


Jobs

As of December, the economy had gained a net total of 3,246,000 jobs since Obama first took office, and the unemployment rate had fallen to 6.7 percent, down from 7.8 percent. But that's a misleading stat.

Despite the gains, more than 10 million people remained unemployed, including 3.9 million who had been out of work for 27 weeks or longer. That’s an increase of nearly 1.2 million “long-term unemployed” since the start of the Obama presidency.

The average time that an unemployed person in December had been looking for work was 37 weeks, nearly double the average at the time Obama entered the White House.

Another troubling jobs statistic is the civilian labor force participation rate, which has now declined by 2.9 percentage points since Obama became president, to the lowest point since 1978. But that’s not entirely due to discouraged workersdropping out because they believe no jobs are available, as some Obama critics would have you believe.

Other labor-force dropouts include members of the baby-boom generation, who are retiring in droves. They also include disabled workers gaining Social Security disability benefits (a number that has doubled in the past 17 years, and is up 20 percent just since Obama took office).

There’s a lively debate among economists about the causes — and implications — of the shrinking participation rate, which started long before Obama took office. The rate actually peaked in early 2000 and declined 1.5 percent under Obama’s predecessor. A Labor Department economist, looking at current demographic trends, predicts further declines through at least 2022 — long after the end of Obama’s presidency.


Slowing Health Care Costs

Health care costs have risen only moderately since Obama took office, but not for the reason the White House wants you to think.

The most recent official figures were posted by the Centers for Medicare & Medicaid Services, whose nonpartisan economists and statisticians have tracked health care spending since 1960. CMS officials also published their findings in a Jan. 6 article in the journal Health Affairs.

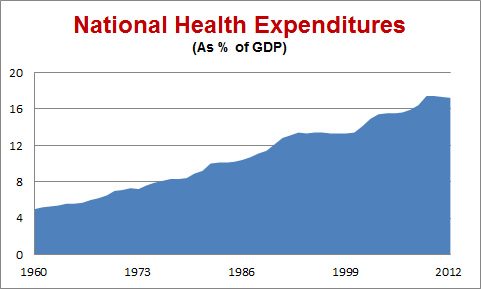
The figures show health care spending in the U.S. rose 3.7 percent in 2012, and stood 15.8 percent higher than it did in 2008, the year before Obama took office.

That’s moderate by historical standards. And the White House was quick to claim credit.

Jason Furman, chairman of the president’s Council of Economic Advisers, published an op-ed piece in the Wall Street Journal Jan. 6 under the headline, “ObamaCare Is Slowing Health Inflation.” In the body of the piece, he argued that the slowdown in health costs is due “in part” to the Affordable Care Act, which he said is making a “meaningful” contribution. He cited, for example, the law’s provision penalizing hospitals if too many patients need to be readmitted, which he said has helped reduce hospital readmission rates by more than 1 percentage point.

But the nonpartisan number-crunchers at CMS said in their Health Affairs article that the ACA had only a “minimal” impact on the slowdown in spending. The reasons they cited instead were:
The economic slowdown and subsequent sluggish recovery
Drops in some prescription drug costs brought about by the expiration of patents on several costly medications including Lipitor, Plavix and Singulair, which are now available in low-cost generic versions, and
A one-time reduction in Medicare payment levels to skilled nursing facilities.

The Health Affairs authors suggested the slowdown in health spending may only be temporary, as has been the case after past recessions.


Health care spending consumed a record 17.4 percent of the nation’s entire economic output in the recession-plagued year of 2009. That declined only slightly, to 17.2 percent, in 2012.

“[T]his pattern is consistent with historical experience when health spending as a share of GDP often stabilizes approximately two to three years after the end of a recession and then increases when the economy significantly improves,” the authors said.

To conclude that the slowdown is permanent, they said, would require “more historical evidence.”


Moderate Inflation

Other costs have risen even more slowly under Obama. As of November, the Consumer Price Index has risen 10.3 percent since he first took office. Some policymakers even worry the inflation rate might be too low — foreshadowing sluggish economic growth in the future.

The highly visible (and highly volatile and highly politicized) price of regular gasoline stood at a national average of $3.33 per gallon in the week ended Jan. 13. That’s more than half a buck cheaper than it was in September 2012, when Republicans were making it an election issue. The recent price is 80 percent higher than it was when Obama took office in the midst of a worldwide recession, which had dampened demand. But the price under Obama has never equaled the historic high of more than $4 per gallon that it reached in June and July 2008, before he took office.


Disappointing Exports

The president has a long way to go to meet his goal of doubling exports of U.S. goods and services, which he first made in his 2010 State of the Union address. So far, exports have increased only 33.6 percent since Obama took office, according to data from the U.S. Commerce Department. (We compared seasonally adjusted figures for the fourth quarter of 2008 with those for the July – September quarter of 2013, the most recent figures available.)

Obama is facing the same global economic headwinds that he did six months ago, when we last updated the export figure. Simply put, overseas customers are still struggling. European unemployment is stuck at 12 percent, for example. And China’s economic growth has slowed and remains problematic. The president mentions his 2010 National Export Initiative on occasion. But at the current rate he won’t come close to meeting his original goal of doubling exports by the end of 2014.


Rising Federal Debt

The president is fond of boasting that annual federal deficits are falling rapidly. But they remain large by historical standards. And the fact is, they are piling up.

Total federal debt now stands at nearly $17.3 trillion, which is 63 percent higher than when Obama took office. That figure includes money the government owes to itself, chiefly through the Social Security trust funds.

A figure that economists consider more important — the debt the government owes to the public — has risen even more dramatically. That figure now stands at $12.3 trillion, an increase of 95 percent under Obama. At the current rate it will surely rise to a doubling during Obama’s presidency — possibly by the time of our next update three months hence.

Net interest payments consumed 6.4 percent of all federal spending in the fiscal year that ended Sept. 30. And the nonpartisan Congressional Budget Office officially projects that interest payments will gobble up an even bigger share of federal spending in the future. “CBO expects interest rates to rebound in coming years from their current unusually low levels, sharply raising the government’s cost of borrowing,” CBO said in its most recent long-term budget outlook document.


Government Workers

While cash-strapped state and local governments have been laying off teachers, firefighters, police and other workers, the federal government has increased the number of its employees under Obama.

The most recent figures from the Bureau of Labor Statistics show that as of December, workers on the federal payroll (excluding postal workers) numbered more than 2.1 million, up 3.2 percent since January 2009.

During the same time, the number of workers on state payrolls went down 3 percent and those on local government payrolls declined by 3.5 percent. A big reason for the disparity is that state and local governments generally must balance their spending and income each year, while the federal government can keep up spending by borrowing.

The figures also show that in recent months state and federal governments have been able to hire back some of their laid-off workers. Obama’s hiring spree also peaked in 2011 (ignoring spikes in hiring of temporary Census workers in 2010), and the number of non-postal federal workers has gone down more or less steadily during the budget battles of the past two years. But the number is above where it was when he took office.


Stagnant Wages, Record Corporate Profits

The divide between the affluent and ordinary wage earners — which the president last month called the “defining challenge of our time” — has widened during his time in office.

Wages remain stagnant, barely keeping up with inflation. Average weekly earnings of workers on payrolls, measured in inflation-adjusted dollars, have edged up a scant 0.3 percent between Obama’s first month in office and November 2013, the most recent on record. And there’s no clear upward trend. We reported a 0.1 percent increase in the real earnings figure in our July update six months ago, but that had evaporated by the time of our October update three months later, when the figure was exactly zero.

Relatively fewer people now own their own homes. Under Obama, the home ownership rate has declined by 2.4 percentage points, to 65.1 percent in the July-September quarter, according to U.S. Census figures. (The decline actually began in 2004, when the rate peaked at 69.4 percent as the housing bubble was inflating.)

And the number of low-income persons on food stamps (now called Supplemental Nutrition Assistance, or SNAP) continues at near-record levels. The most recent figures from the Department of Agriculture put the number receiving benefits at just over 47.4 million as of October — or 15 percent of the entire U.S. population.

That’s down a bit from the nearly 47.8 million record set in December 2012. But it is still an increase of 48.3 percent during Obama’s presidency.

The increase in food stamp beneficiaries is due partly to economic pressures, but also to liberalizations in both benefits and eligibility under President Obama and also under his predecessor. We covered those in some detail back in 2012 when GOP presidential candidate Newt Gingrich accused Obama of being the “food stamp president.” The number of food stamp beneficiaries increased by 14.7 million during Bush’s two terms in office, and is up another 15.4 million under Obama.

One factor behind Obama’s increase is that benefit levels were raised in 2009 as part of his economic stimulus program. That “temporary” increase was extended several times, and didn’t lapse until Nov. 1 last year.

But while wage earners and low-income people struggle, corporate profits keep setting records. Even after taxes, corporate profits were running at an annual rate of nearly $1.9 trillion in the July-September quarter of last year, the most recent for which figures are available. That’s nearly triple the rate during the three months before Obama became president — an increase of 178 percent.

To be sure, that last quarter of 2008 was the worst since 2002, thanks to the worst business recession since the Great Depression. But profits rebounded to well above previous levels. Profits in the most recent quarter were running 33 percent higher than the highest level seen before 2009, which was the third quarter of 2006, when profits ran at a rate of $1.4 trillion.

Obama’s time in office also has been good for those who own corporate stocks — whose values have doubled and more under Obama. As of the close of the market on Jan. 14, the Standard & Poor’s 500 stock index was 128 percent higher than it was when Obama first took office.

Other market indicators also have soared. The Dow Jones Industrial Average was up 106 percent, and the NASDAQ Composite index had nearly tripled, rising by 190 percent.


Booming Oil, Gas, Wind and Solar

The remarkable and historic boom in U.S. oil and gas production continues. Production of crude oil in the U.S. now has increased 60 percent since Obama took office, while imports of foreign oil and petroleum products have declined by 51 percent, as measured by the most recent Energy Information Administration figures, comparing the most recent three-month period with the last quarter of 2008.

As a consequence, U.S. dependency on imported oil has dropped sharply. The nation imported 34 percent of what it consumed in the first 11 months of 2011, according to the most recent EIA figures. (See Table 3.3a, “net imports” as a percent of “product supplied.”) That’s a drop of 23 percentage points from 2008, when the U.S. imported 57 percent. The decline actually began in George W. Bush’s second term, after U.S. dependency peaked at 60.3 percent in 2005. But the trend has gathered momentum under Obama.

As we’ve said before, the U.S. energy boom is a result primarily of the use of new drilling technology by the industry, not of any policy changes in Washington. But the president hasn’t been in any hurry to impose restrictions on the hydraulic fracturing method. The Environmental Protection Agency has been studying the impact of “fracking” on drinking water for years. It announced the study March 18, 2010, and issued a “progress report” Dec. 21, 2012. The EPA says it expects a draft report to be released for scientific peer review sometime this year.

Another factor behind reduced U.S. dependency on imported oil is more fuel-efficient automobiles. The latest figures from the University of Michigan’s Transportation Research Institute show the average EPA city/highway “window sticker” mileage of cars and light trucks sold in December was 24.8 miles per gallon, an improvement of 18 percent over the average for vehicles sold in the month that Obama took office.

Washington is now calling for even greater efficiency in the future. The Obama administration has put in place requirements that cars and light trucks average 54.5 mpg by model year 2025. But it remains to be seen whether the industry can produce such vehicles and get Americans to buy them, and whether future presidents will stick to Obama’s ambitious goal.

Under Obama, wind and solar power has tripled. In the most recent 12 months on record (ending in October) electricity generated by wind and solar had increased by 206 percent over the total for 2008. That was spurred in part by large federal tax subsidies for wind and solar generation.

Despite the large percentage increase in wind and solar generation, such energy accounted for just under 3.2 percent of all electricity generated in the U.S. in the July-September quarter of 2013, the most recent on record. Coal still accounts for the biggest share, followed by natural gas and nuclear power.

War and Terrorism

The detention facility for suspected terrorists remains open at the Guantanamo Naval Base in Cuba, despite the order Obama signed two days after taking office, directing that it be closed within one year. On Dec. 31 the U.S. announced it was releasing three more prisoners — all ethnic Uighur Chinese nationals — and transferring them to Slovakia, which had agreed to resettle them. But that leaves 155 “detainees” in custody (the Pentagon prefers not to call them “prisoners”), a number just 36 percent below the 242 who were being held nearly five years ago when Obama became president.

And the war in Afghanistan grinds on. According to official Pentagon figures, the U.S. has suffered a total of 1,676 military fatalities since 2008 in Operation Enduring Freedom.

Since 2008, a total of 264 U.S. military fatalities were attributed to the two Iraq war operations, Operation Iraqi Freedom and Operation New Dawn, according to official Pentagon figures. Although the last U.S. troops left Iraq at the end of 2011, two deaths were attributed to the conflict in 2012: Marine Staff Sgt. Oscar Eduardo Canon, who died in February 2012 of wounds suffered earlier, and Army Staff Sgt. Ahmed Kousay al-Taie, who had been missing since 2006 and whose remains were identified in February 2012.

– by Brooks Jackson
Sources

Bureau of Labor Statistics. “Employment, Hours, and Earnings from the Current Employment Statistics survey (National); Total Nonfarm Employment, Seasonally Adjusted.” Data extracted 14 Jan 2014.

Bureau of Labor Statistics. “Labor Force Statistics from the Current Population Survey; Unemployment Rate, Seasonally Adjusted.” Data extracted 14 Jan 2014.

Bureau of Labor Statistics. “Labor Force Statistics from the Current Population Survey; Unemployment Level, Seasonally Adjusted.” Data extracted 14 Jan 2014.

Bureau of Labor Statistics. “Labor Force Statistics from the Current Population Survey; Number Unemployed for 27 Weeks & Over, Seasonally Adjusted.” Data extracted 14 Jan 2014.

Bureau of Labor Statistics. “Labor Force Statistics from the Current Population Survey; Labor Force Participation Rate, Seasonally Adjusted.” Data extracted 14 Jan 2014.

Bureau of Labor Statistics. “Labor Force Statistics from the Current Population Survey; Not in Labor Force, Searched For Work and Available, Discouraged Reasons For Not Currently Looking, Unadjusted.” Data extracted 14 Jan 2014.

Social Security Administration. “Number of Social Security recipients—time series for selected benefit type: Disabled Workers.” Data extracted 14 Jan 2014.

Klein, Matthew C. “Is Jobless Rate Really Falling?” Bloomberg News. 9 Jan 2014.

Toossi, Mitra. “Labor force projections to 2022: the labor force participation rate continues to fall.” Monthly Labor Review. Dec 2013.

Martin, Anne B. and Micah Hartman, Lekha Whittle, Aaron Catlin and the National Health Expenditure Accounts Team. “National Health Spending In 2012: Rate Of Health Spending Growth Remained Low For The Fourth Consecutive Year.” Health Affairs. Jan 2014.

Furman, Jason. “ObamaCare Is Slowing Health Inflation.” Wall Street Journal. 6 Jan 2014.

Petrof, Alanna. “Euro zone unemployment at 12%, while U.S. improving.” CNN Money. 8 Jan 2014.

China’s Stocks Fall to Five-Month Low on Economic Growth Concern.” Bloomberg News. 5 Jan 2014.

White House. “Remarks by the President in the State of the Union.” 27 Jan 2010.

Bureau of Labor Statistics. “Consumer Price Index – All Urban Consumers.” Data extracted 14 Jan 2014.

Inflation, Strangely Low, Holds Key to 2014 Fed Policy.” Thompson/Reuters. 12 Jan 2014.

U.S. Energy Information Administration. “Weekly U.S. Regular All Formulations Retail Gasoline Prices.” Data extracted 14 Jan 2014.

Obama, Barack “Remarks by the President in State of the Union Address.” White House Office of the Press Secretary. 27 Jan 2010.

Petroff, Alanna. “Euro zone unemployment at 12%, while U.S. improving.” CNN Money. 8 Jan 2014.

China’s Stocks Fall to Five-Month Low on Economic Growth Concern.” Bloomberg News. 5 Jan 2014.

U.S. Treasury. “The Debt to the Penny and Who Holds It.” 10 Jan 2014. Data extracted 14 Jan 2014.

U.S. Treasury. “Final Monthly Treasury Statement of Receipts and Outlays of the United States Government For Fiscal Year 2013 Through September 30, 2013, and Other Periods.” Undated. Accessed 14 Jan 2014.

Congressional Budget Office. “The 2013 Long Term Budget Outlook.” Sept 2013.

Bureau of Labor Statistics. “Employment, Hours, and Earnings from the Current Employment Statistics survey (National); Government, Federal, except U.S. Postal Service, Seasonally Adjusted.” Data extracted 14 Jan 2014.

Bureau of Labor Statistics. “Employment, Hours, and Earnings from the Current Employment Statistics survey (National); Government, State Government, Seasonally Adjusted.” Data extracted 14 Jan 2014.

Bureau of Labor Statistics. “Employment, Hours, and Earnings from the Current Employment Statistics survey (National); Government, Local Government, Seasonally Adjusted.” Data extracted 14 Jan 2014.

Obama, Barack. “Remarks by the President on Economic Mobility.” White House Office of the Press Secretary. 4 Dec 2013.

Bureau of Labor Statistics. “Employment, Hours, and Earnings from the Current Employment Statistics survey (National); Average Weekly Earnings of All Employees, 1982-1984 Dollars.” Data extracted 14 Jan 2014.

U.S. Census Bureau. “Time Series: Seasonally Adjusted Home Ownership Rate.” Data extracted 14 Jan 2014.

U.S. Department of Agriculture, Food and Nutrition Service. “Supplemental Nutrition Assistance Program (Data as of January 10, 2014).” Data extracted 14 Jan 2014.

Plumber, Brad. “Food stamps will get cut by $5 billion this week — and more cuts could follow.” Washington Post Wonkblog. 28 Oct 2013.

Federal Reserve Bank of St Louis. “Corporate Profits After Tax (without IVA and CCAdj) (CP).” Data extracted 14 Jan 2014.

Google Finance. “S&P 500.” Historical prices. Accessed 14 Jan 2014.

Google Finance. “Dow Jones Industrial Average.” Historical prices. Accessed 14 Jan 2014.

Google Finance. “NASDAQ Composite.” Historical prices. Accessed 14 Jan 2014.

U.S. Energy Information Administration. “U.S. Crude Oil Production.” Accessed 14 Jan 2014.

U.S. Energy Information Administration. “Table 3.3a. Monthly Energy Review.” Dec 2013.

U.S. Energy Information Administration. “Table 1.1.A. Net Generation by Other Renewables: Total (All Sectors), 2003-April 2013.” Accessed 14 Jan 2014.

U.S. Environmental Protection Agency. “EPA Initiates Hydraulic Fracturing Study: Agency seeks input from Science Advisory Board.” News release. 18 Mar 2010.

U.S. Environmental Protection Agency. “EPA Releases Update on Ongoing Hydraulic Fracturing Study.” News release. 21 Dec 2012.

University of Michigan Transportation Research Institute. “Average sales-weighted fuel-economy rating (window sticker) of purchased new vehicles for October 2007 through December 2013.” 8 Jan 2014.

Obama Administration Finalizes Historic 54.5 MPG Fuel Efficiency Standards.” News release, White House Office of the Press Secretary. 28 Aug 2012.

U.S. Energy Information Administration. “Electric Power Monthly: Table 1.1.A. Net Generation from Renewable Sources: Total (All Sectors), 2003-October 2013.” 20 Dec 2013.

U.S. Energy Information Administration. “Electricity Data Browser: Net Generation.” Data extracted 14 Jan 2014.

Closure Of Guantanamo Detention Facilities: Executive Order – Review and Disposition of Individuals Detained at the Guantanamo Bay Naval Base and Closure of Detention Facilities.” The White House. 22 Jan 2009.

U.S. Department of Defense. “Detainee Transfer Announced.” News release. 31 Dec 2013.

U.S. Department of Defense, Defense Casualty Analysis System. “U.S. Military Casualties – Operation Enduring Freedom (OEF) Casualty Summary by Month.” Data extracted 14 Jan 2014.

U.S. Department of Defense, Defense Casualty Analysis System. “U.S. Military Casualties – Operation Iraqi Freedom (OIF) Casualty Summary by Month.” Data extracted 14 Jan 2014.

U.S. Department of Defense, Defense Casualty Analysis System. “U.S. Military Casualties - Operation New Dawn (OND) Casualty Summary by Month.” Data extracted 14 Jan 2014.

Shapiro, Joseph. “Remembering Marine Sgt. Oscar Canon, A ‘Superstar.’ ” National Public Radio. 24 Feb 2012.

Missing U.S. soldier killed by Shiite group.” The Associated Press. 27 Feb 2012.

Thursday, January 16, 2014

The Deadly Wages of Free Trade

"Failed Everywhere It's Been Tried"
by DANIEL KOVALIK


Back in the mid-1990’s, the signatories to the North American Free Trade Agreement promised that the border town of Ciudad Juarez, Mexico would become the model city for the new “free trade” pact. Indeed, it has become a model city for NAFTA, but not in the way its architects had intended. Thus, rather than becoming a showcase for economic development and prosperity which “free trade” promised to usher in, Ciudad Juarez instead has become a city plagued by murder rates equivalent to nations at war, and has witnessed the bizarre phenomenon of “femicide” which has violently claimed the lives of around 400 girls and young women since the passage of NAFTA. [1]

In a similar vein, the port town of Buenaventura has become the poster child for the Colombia Free Trade Agreement. Even before the FTA was finally ratified by Congress and signed into law by President Obama in October of 2011, violence began to plague Buenaventura as armed paramilitary groups vied for control of the new ports being built in preparation for the influx of trade which the FTA was to bring. Thus, in September of 2011, acclaimed human rights advocate, Father Javier Giraldo, S.J., wrote to U.S. Ambassador P. Michael McKinley of
the permanent genocide that is being carried out in Buenaventura, where the neighborhoods and the Community Councils around the port are being invaded by paramilitaries supported or tolerated by the armed forces. They cut people in pieces with horrifying cruelty throwing the body parts in to the sea, if any of them dare to resist the megaproject for the new port. This included the expulsion of people living in the poorest areas and it includes the expropriation of the plots of garbage dumps where these people, in the midst of their misery, have over decades tried to survive. [2]

Since the passage of the Colombia FTA, the violence in Buenaventura has only increased, and sadly bears resemblances to the violence in Ciudad Juarez after the passage of NAFTA. Thus, as explained by a recent report on the growing post-FTA violence in Colombia by two top Democrats on the U.S. House Committee on Education and the Workforce (“Committee report”):
three illegal post paramilitary demobilization groups or re-grouped paramilitaries (La Empresa, Los Urabeňos and Los Rastrojos) are engaged in a violent battle for control of the neighborhoods in the port areas [of Buenaventura]. These groups utilize brutal terror tactics to exert control and dominate the population. The Member and his staff were told about the use of chainsaws to dismember persons in broad daylight or in “torture houses” where residents can hear the screams. Among the victims were a large number of women who were first raped or sexually tortured before being killed in a sadistic manner and their body parts displayed publicly to set an example to others. Local groups estimate that at least eight Afro-Colombian women have been assassinated in this fashion in 2013 alone. This situation unfolds in areas where the public and security armed forces (police and military) are either present or very close by. [3]

The Committee report further explains that, “[w]hile Buenaventura is a strategic hub for international commerce, the riches of this growing global economy fomented by the U.S.-Colombia FTA mainly pass through Buenaventura and do not integrate or benefit the local Afro-Colombian population.” Thus, “[s]ixty-three percent of Buenaventura’s residents who are Afro-Colombian live under the poverty line, and unemployment is 64 percent.”

Mass displacements from Buenaventura, caused by violence and the threat of violence by the paramilitary groups fighting for control of the ports, are also a growing problem. As the Committee report explains, relying upon figures from the UN High Commissioner of Refugees, an estimated 9,000 persons became internally displaced in 11 massive displacements in Buenaventura. In 2013, four displacements totaling some 1,600 persons have taken place thus far.”

And sadly, just after this Committee report was released, the UN Office for the Coordination of Humanitarian Affairs (OCHA) reported on but another incident of mass displacement in Buenaventura. As the OCHA explained,
at least 2,516 people from 629 families from comunes 3 and 4 in the Pacific port city of Buenaventura, Valle, have displaced from their neighborhoods to the local headquarters of Caritas Colombia following threats by Post-demobilization Armed Groups (PDAGs) and pressure caused by repeated armed confrontations between these groups. The displacements began early in the morning on Wednesday 6 November [2013] and affected the areas of La Playita, Alfonso López, Calle El Ramiro and Viento Libre. [4]

Of course, Buenaventura is but a microcosm of the havoc being wrought as a direct consequence of the FTA. Thus, the FTA, which is accelerating the land grab by multi-national agribusiness and mining interests, has helped to make Colombia the number one country in the world for internal displacements, with nearly 5 million internally displaced peoples (IDPs) and growing, and with indigenous peoples and Afro-Colombians disproportionate victims of this displacement. [5] Again, this displacement mirrors that of Mexico after NAFTA when nearly 2 million small farmers were displaced as a direct consequence of the agricultural provisions of that arrangement.

I leave you with the words of the founding father of the modern “free trade” treaty, former President Bill Clinton, who in testimony before the Senate in 2010 admitted this has “failed everywhere it’s been tried.” Sadly, Colombia, as Mexico, proves these words of Mr. Clinton to be all too true. [6]

Notes:
[1] For a very good description of the connection between NAFTA and the “femicide” in Ciduad Juarez, read, “Capitalism, A Structural Genocide” by Garry Leech.  See, http://www.amazon.com/Capitalism-Structural-Genocide-Garry-Leech/dp/1780321996
[2] http://www.javiergiraldo.org/spip.php?article212
[3]http://democrats.edworkforce.house.gov/sites/democrats.edworkforce.house.gov/files/documents/Colombia%20trip%20report%20-%2010.29.13%20-%20formatted%20-%20FINAL.pdf
[4] http://reliefweb.int/report/colombia/flash-update-no-1-–-mass-intra-urban-displacement-buenaventura-valle-del-cauca
[5] http://www.hrw.org/news/2013/09/17/colombia-victims-face-reprisals-reclaiming-land
[6] See, http://www.democracynow.org/2010/4/1/clinton_rice Bill Clinton was speaking of the free trade agricultural policies in Haiti which undermined that country’s ability to feed itself.  These are the very same policies which undermined the livelihoods of the approximately 2 million small farmers in Mexico who were displaced as a consequence, and which are devastating the Colombian country side now.

No Jobs For Americans

The Phony Recovery
by Paul Craig Roberts


The alleged recovery took a direct hit from Friday’s payroll jobs report. The Bureau of Labor Statistics reported that the economy created 74,000 net new jobs in December.

Wholesale and retail trade accounted for 70,700 of these jobs or 95.5%. It is likely that the December wholesale and retail hires were temporary for the Christmas shopping season, which doesn’t seem to have been very exuberant, especially in light of Macy’s decision to close five stores and lay off 2,500 employees. It is a good bet that these December hires have already been laid off.

A job gain of 74,000, even if it is real, is about half of what is needed to keep the unemployment rate even with population growth. Yet the Bureau of Labor Statistics reports that the unemployment rate fell from 7.0% to 6.7%. Clearly, this decline in unemployment was not caused by the reported 74,000 jobs gain. The unemployment rate fell, because Americans unable to find jobs ceased looking for employment and, thereby, ceased to be counted as unemployed.

In America the unemployment rate is a deception just like everything else. The rate of American unemployment fell, because people can’t find jobs. The fewer the jobs, the lower the unemployment rate.

I noticed today that the financial media presstitutes were a bit hesitant to hype the drop in the rate of unemployment when there was no jobs growth to account for it. The Wall Street and bank economists did their best to disbelieve the jobs report as did some of the bought-and-paid-for university professors. Too many interests have a stake in the non-existent recovery declared 4.5 years ago to be able to admit that it is not really there.

I have been examining the monthly jobs reports for a decade or longer. I must say that I as struck by the December report. Normally, a mainstay of jobs gain is the category “education and health services,” with “ambulatory health care services” adding thousands of jobs. In December the net contribution of “education and health services” was zero, with “ambulatory health care services” losing 4,100 jobs and health care losing 6,000 jobs. If memory serves, this is a first. Perhaps it reflects adverse impacts of the ripoff known as Obamacare, possibly the worst piece of domestic legislation passed in decades.

I was also struck by the report that the gain in employment of waitresses and bartenders, normally a large percentage of the job gain, was down to 9,400 jobs, which were offset by declines elsewhere, such as the layoff of local school teachers.

Aren’t Washington’s priorities wonderful? $1,000 billion per year in Quantitative Easing, essentially subsidies for 6 banks “too big to fail,” and nothing for school teachers. It should warm every Republican’s heart.

A tiny bright spot in the payroll jobs report is 9,000 new manufacturing jobs. The US manufacturing workforce has declined so dramatically since jobs offshoring became the policy of American corporations that 9,000 jobs doesn’t register on the scale. Fabricated metal products, which I think is roofing metal, accounted for 56% of the manufacturing jobs. Roofing metal is not an export. Employment in the production of products that could be exported, such as “computer and electronic equipment,” and “electronic instruments” declined by 2,400 and 3,500 respectively.

Clearly, this is not a payroll jobs report that provides cover for the looting of the prospects of ordinary Americans by the financial and offshoring elites. One can wonder how the BLS civil servants who produced it can avoid retribution. It will be interesting to see what occurs in the January payroll jobs report.

Inside the December Jobs Report

False Positives Revisited
by JACK RASMUS


In a blog post this past November 2013, this writer offered a contrarian analysis of the October 2013 government jobs report. That report indicated a jobs gain of 204,000 for October. While others heralded the number, claiming it was evidence that the US jobs market had (yet again) ‘turned the corner’, this writer forewarned the October job gains would prove temporary. My contrarian view was that the October job gains reflected a temporary surge in 3rd quarter U.S. GDP, which was itself based largely on a short term surge in business inventory accumulation that Qtr., with a lagged October hiring effect. The October jobs numbers were therefore “nothing to get excited about” and “can disappear quickly from the economy and may in fact do so by December should consumer spending come in well below expectations.” (see my ‘False Positives’ piece on this blog, of November 12, 2013).

It appears that ‘disappearance’ is what has happened, as last week’s December jobs report showed a net job gain of only 74,000. So what’s going on?

Last month’s jobs report shows not only that job creation has relapsed once again, but that weak job creation is not the only problem with the US labor market. While only 74,000 jobs were created, the labor force in the US shrunk by a further 347,000 workers in December as well. Hundreds of thousands of workers have been dropping out of the labor force in recent months. Both indicators—weak job creation and massive labor force exiting—reflect a labor market in deep trouble still, after nearly five years of so-called recovery.

The 347,000 exits from the labor force in December follow another, even greater exodus of 700,000 in October. Even if half of that number may be due to the government shutdown event of that month, it’s still another 350,000 exits. What the last three months shows, therefore, is that at least as many workers are leaving the labor force, as there are jobs are being created. A kind of a ‘churn’ is therefore taking place.

During the first six months of 2013, about two thirds of all the jobs created were ‘contingent’ jobs—i.e. part time and temp jobspaying well below the average hourly rate. So in the first half of 2013 another kind of ‘churn’ was also taking place: full time jobs were being lost while part time and contingent jobs were being created. That also meant that higher paying jobs were being replaced by lower paying—a trend that has been going on for several years now.

That contingent hiring trend in the first half of the year has moderated somewhat in the second half of 2013, and replaced by the new trend of an accelerating exodus of workers from the labor force.

So it is not just stop-go, month to month job creation , but low-paid contingent job creation, and the massive number of workers leaving the labor force that together represent the major defining characteristics of the US labor market over the past year. It’s not a pretty picture.

The fact that between 700,000 and 1 million workers have left the labor force in just the last three months makes the unemployment rate as an indicator of the health of the jobs market an irrelevant statistic. Because of the way the US erroneously calculates the unemployment rate, a massive drop in the labor force results in a convenient fall in the unemployment rate. Those who leave the labor force are not included in the determination of the unemployment rate. They may be jobless, but aren’t included as unemployed in the government’s oxymoronic method for calculating unemployment. Consequently it is the mass exodus—not a big increase in actual jobs—that is lowering the unemployment rate.
Most serious economists know the unemployment rate is misleading, and don’t put much trust in the unemployment rate as an indicator. They supplement it by looking at other indicators: job openings, turnovers, quit rates, average work week, jobless claims, duration of unemployment, etc. But most of these are short term indicators, and can be volatile and unpredictable month to month.

A better indicator of the long term declining health of the US labor market is the labor force participation rate, and the related employment-to-population ratio. They show how well the US economy has been producing jobs longer term and as the population grows. And both these indicators continue to show a deep malaise in the US job market.

The labor force participation rate has steadily declined for years in the US, starting before 2008 and accelerating after. In June 2009, the declared official ‘end’ of the current continuing recession for the bottom 95% of us, the civilian labor force in the US totaled 154,926,000 workers. This past December 2013 the total labor force was 154,408,000. At first this appears as if there’s been no change in the labor force. However, one must include in this the estimate that, on average, about 100,000 to 150,000 new workers enter the labor force each month. Taking the low end 100,000 figure, it means in the four and a half years since June 2009, no less than 5.4 million workers have left the labor force. (100,000 x 12 months x 4.5 yrs). That’s about the same number of jobs created in the 4.5 year period.

In June 2009 approximately 139,800,000 workers were employed in the nonfarm labor force in the US. In December 2013, that number had risen to 144,400,000. So about 5 million new jobs have been created in the past 4.5 years, averaging 93,000 a month, while about 100,000 a month on average have also been leaving the labor force. (Numbers for both the labor force and nonfarm jobs above are from the US Labor Department’s ‘Current Population Survey’).

What we have therefore is a ‘great jobs churn’ going on in the US labor market since 2010—new entrants coming in at low pay, often contingent, service jobs while roughly the same number of workers leave the labor force who were once higher paid. And because the labor force drop outs aren’t counted as unemployed, it appears as if the labor market is improving since the unemployment rate is declining.

The December picture is even more dismal than the numbers above indicate. Both the 74,000 jobs and -347,000 drop in labor force that occurred in December 2013 are ‘statistics’. That is, they are not the actual numbers. Statistics are manipulations on raw data and actual numbers. They are ‘operations’ on the data, in most cased designed to smooth out the swings and fluctuations in the raw data that occur due to seasonality and other factors.

The raw data on jobs created and labor force exits for December show an even worse picture than that reported by the ‘stats’. The raw data show total nonfarm jobs actually fell by -246,000 instead of growing by 74,000, and the labor force declined by -502,000.

Whether statistically smoothed or the actual raw data, the jobs numbers for December were disastrous. Some argue the abysmal December numbers reflect a correction to the excessively high, 200,000 plus numbers for October and November. Others argue that the bad December numbers result from bad weather. But weather metaphors aren’t an explanation; they are an excuse for those without an explanation for what’s going on. And if the US government is consistently that inaccurate estimating jobs month to month—i.e. widely over-reporting one month and under-reporting another—then that should raise red flags about its methods to being with.

It may very well be that the Labor Department’s established methodologies for estimating jobs are today out of whack and unable to account for the fundamental changes in the labor markets that the recent deep recession has caused—such as the accelerating rise of contingent labor, the massive swings and exits from the labor force, the shift of millions from employment to disability insurance, a growing urban shadow economy that is misestimated in terms of jobs, methods for accounting for new business formation effects on job creation, the diversion of job creating investment from the US to offshore emerging markets and/or into financial asset speculation, the hoarding of trillions in cash by big multinational corporations, the increasing job displacement effect of capital investment, the negative effects of expanding free trade on jobs, and so on.

All this is not to say the December job statistics are purposely ‘falsified’ by the government in some conspiratorial fashion. The methods are perhaps just outdated. The Labor Department does report the raw data for jobs, for example. It is just that the capitalist media simply chooses to report the less severe statistical data as the sole ‘truth’, ignoring the raw data, and saying nothing about how changes in the real economy may be undermining the accuracy of the old statistical methodologies. Or the press hypes the weather as the cause of the poor job numbers, or suggests temporary technical factors are responsible.

However, neither technical factors nor bad weather are necessary to explain the poor December jobs numbers. In my initial ‘False Positives’ piece written in early November, it was suggested that the big surge in 3rd quarter 2013 GDP in business inventory accumulation likely explains much of the lagged big surge in October-November jobs. Business bulked up on inventories in the 3rd quarter, in what has proven to be an erroneous expectation of a big consumer spending surge over the recent holiday season. The production of those inventories, and expectations of follow-on retail sales in the closing months of 2013, explain the brief hiring surge in October-November—as well as the subsequent sharp slowdown (seasonally adjusted) or actual decline (raw data) in December jobs. The ‘False Positives’ piece predicted that the anticipated retail sales at year end would not follow the 3rd quarter inventory buildup—and that would all result in a major reduction in job creation by December.

Data for December just reported show an overall growth of retail sales of only 0.2%–which is a decline from a prior, already weakening, November number of 0.4%. In fact, retail sales have been consistently weak since the September ‘back to school’ event. Sales have slipped ever since. Sales this past holiday season were the worst since 2009, according to a ‘Market Watch’ business research review of the data, as of the week ending December 28.

At the heart of the December slowdown in retail were auto sales. Autos have been the major force holding up consumer spending throughout the past year. However now it appears the US auto market, after several years of historic discounting to boost auto sales, is now becoming relatively saturated. For example, GM’s auto sales declined 6% in December from the prior year and its truck sales even more.

While others note that non-auto retail sales rose in December, non-auto sales also reflected weak economic conditions as retailers introduced large discounts in the final weeks of the monthas it appeared consumers were reducing their expenditures. Those discounts will soon result in lower retail profits, and in turn therefore disappear in January-February 2014. Thus both autos and non-auto retail are therefore set to slow or even decline in coming months. In turn, the job creation picture could weaken still further in early 2014.

To summarize, what lies behind the December jobs slowdown, and the accelerating exodus of jobless workers from the labor force, is the likely pullback in business inventory spending at year end and the weak prospects for retail sales. Hiring slowed significantly at year end, and many of those that were hired in the fall—as inventories bulked up and big retail sales were anticipated—will soon be laid off once again.

Entering 2014, the picture will likely be one of further retreat in business inventory accumulation, more softness in retail sales, fewer hires, and a continuing slowdown in auto sales, and in turn fewer hires and more layoffs.

But the raw jobs numbers for early 2014 may be ‘smoothed out’ once again by the statistical changes forthcoming in early 2014, as the government is scheduled to change its ‘benchmarks’ for estimating jobs that could ‘statistically’ boost jobs by several hundred thousand. That statistical adjustment could effectively ‘drown out’ a continuing weak jobs creation picture when measured by the actual raw jobs data. It may appear the jobs picture is not as bad as it actually is in fact—when the raw data will show otherwise. But you won’t hear that from the mainstream press.

Is This the End of Net Neutrality?

Privatizing the Public Good
by DAVID ROSEN


On Tuesday, Jan. 14th, the D.C. Circuit Court of Appeals struck down the Federal Communications Commission’s (FCC) Open Internet Order. In its decision, the Court found that the FCC lacked the authority to implement and enforce the order it put forth in 2011.

The FCC’s order was intended to prevent broadband Internet service providers (ISPs) from blocking or interfering with data traffic on the web. This policy – if significantly watered down — is in keeping with the both the open access traditional of U.S. communications services since the 1930s and the spirit of the Internet since its inception three decades ago.

Verizon challenged the FCC’s authority to regulate digital communications. Historically, ISPs must treat all data equally and are barred from slowing down or blocking websites. Verizon claimed that FCC regulatory practice violates its 1st Amendment right to edit, prioritize or block its customers’ access to the Internet. Ironically, the Court’s decision comes after a 2010 ruling that the FCC could not stop Comcast from blocking BitTorrent’s video sharing program.

The Court found that the FCC, having deceptively reclassified the Internet as a “information” services, could not impose the same obligations as traditional “common carrier” telecom services like old-fashion “pots” (plain-old-telephone). Judge David Tatel wrote, “Given that the Commission has chosen to classify broadband providers in a manner that exempts them from treatment as common carriers, the Communications Act expressly prohibits the commission from nonetheless regulating them as such.”

The FCC’s effort to reclassify the Internet as an “information” services was part of Bush-era policy to privatize online services. Pres. Obama’s former FCC Chairman Julius Genachowski — in the face of considerable public, activists and high-tech corporate pressure — tried to “square the circle” and maintain net neutrality while classifying the Internet as an information service. The Court’s decision is a rejection this legal fiction.

Over the last decade-plus, there’s been an increasingly close relationship between the FCC and its corporate clients – to the detriment of the public good. This was most graphically displayed in 2011 when Commissioner Meredith Attwell Baker, shortly following her approval of Comcast’s acquisition of NBC Universal, took a well-paying position with the cable giant.

Similar revolving doors are evident in the career paths of some recent chairmen. Kevin Martin, a Bush-II appointee, is now with Patton Boggs, a leading Washington, DC, law firm and lobbyist. Michael Powell, Gen. Powell’s son and appointed by Clinton, now heads the cable industry trade association, NCTA. William Kennard, also appointed by Clinton, previously an executive with the banking firm, Carlyle Group, where he specialized telecommunications and media in investments; he now serves as the U.S. Ambassador to the European Union. And Genachowski took a position at the Carlyle Group.

In November 2013, Obama replaced Genachowski with Tom Wheeler, a true industry insider, long a water carrier for corporate interests. He served as head of the NCTA from 1979 and 1984, and ran the Cellular Telecom and Internet Association (CTIA) from 1992 through 2004. Most recently, was a managing director at Core Capital Partners, a venture-capital firm, and a longtime Obama fundraiser.

Wheeler is likely to continue the FCC’s pro big-telecom policies. Nevertheless, a few days before the Court’s ruling, he came out with a strong endorsement of net neutrality. “Public policy should protect the great driving force of the open Internet: how it allows innovation without permission,” he said. “This is why it is essential that the FCC continue to maintain an open Internet and maintain the legal ability to intervene promptly and effectively in the event of aggravated circumstances.”

However, in 2009, he took a more compromised position:
Rules that recognize the unique characteristics of a spectrum-based service and allow for reasonable network management would seem to be more important than the philosophical debate over whether there should be rules at all. … The wireless industry’s initial reaction to net neutrality was to question its need and warn of “unintended consequences.” Accepting the inevitability of the concept, however, and working to maximize its positive effects – from appropriate network management, to flexible pricing and even new spectrum – could be the opportunity for a big win.

Say goodbye to net neutrality.

Verizon’s challenge to the FCC’s Internet order is only one element of a multi-faceted campaign to further privatize U.S. telecommunication services. A second front is being pushed by AT&T and involves proposed Congressional legislation that would essentially end all regulatory obligations. It insisted, “AT&T believes that this [traditional] regulatory experiment will show that conventional public-utility-style regulation is no longer necessary or appropriate in the emerging all-IP ecosystem.”

A third front is taking place outside the Washington beltway. The American Legislative Exchange Council (ALEC) has been effectively promoting “model legislation” ending traditional telephone company accountability requirements. Such legislation has been adopted by at least 23 states. This legislation removed ”carrier of last resort” requirements, thus telecoms no longer have to serve small rural communities.

Two decades ago, the telecom companies – phone and cable — promised to build Al Gore’s “Information Superhighway.” To incentivize these private conglomerates, the industry were deregulated, permitting increased pricing, decreased service requirements and nearly no public accountability. Since then, they’ve pocketed an estimated $350 billion to build a post-modern digital telecom system. What do we have today? A 2nd-rate communications system! Further deregulations – especially the killing of net neutrality – will only make things worse.

Last year, many within the broad tech, Internet and media communities organized to halt the Hollywood studios and record companies from pushing new “anti-piracy” laws through Congress. The battle against SOPA-PIPA is a model campaign for the next battle against Verizon, AT&T and ALEC to preserve net neutrality and an open Internet.