Showing posts with label debt-to-GDP ratio. Show all posts

Thursday, July 10, 2014

The Deteriorating Economic Outlook

July 8, 2014

Paul Craig Roberts, Dave Kranzler, and John Williams

The third and final estimate (until the annual GDP revisions) of first quarter 2014 real GDP growth released June 25 by the US Bureau of Economic Analysis was a 2.9% contraction in GDP growth, a 5.5 percentage point difference from the January forecast of 2.6% growth. Apparently, the first quarter contraction was dismissed by those speculating in equities as weather related, as stock averages rose with the bad news.

Stock market participants might be in for a second quarter surprise. The result of many years of changes made to the official inflation measures is a substantially understated inflation rate. John Williams (www.shadowstats.com) provides inflation estimates based on previous official methodology when the Consumer Price Index still represented the cost of a constant standard of living. The 1.26% inflation measure used to deflate first quarter nominal GDP is unrealistic, as Americans who make purchases are aware.

A reasonable correction to the understated deflator gives a much higher first quarter contraction. The two main causes of inflation’s understatement are the substitution principle introduced during the Clinton regime and the hedonic adjustments ongoing since the 1980s that redefine price rises as quality improvements. Correcting for excessive hedonic adjustments gives a first quarter real GDP contraction of 5%. Correcting for hedonic and substitution adjustments gives a first quarter real GDP contraction of 8.5%.

Realistic economic analysis is a rarity. The financial press echoes Wall Street, and Wall Street economists are paid to help sell financial instruments. Gloomy analysis is frowned upon. Even negative quarters are given a positive spin.

Years of understatement of inflation has resulted in years of overstatement of GDP growth. Thinking about the many years of misstatement, we realized that the typical computation in nominal terms of the ratio of debt to GDP is seriously misleading.

Consider that debt is issued in nominal terms and repaid in nominal terms (except for a few Treasury bonds with inflation adjustments). However, nominal wealth or nominal GDP overstates real economic strength. The debt is growing, but both the nominal and real values of the output of goods and services are not keeping up with the rise in debt.

To understand how risky the rise of debt is, nominal debt must be compared to real GDP. Spin masters might dismiss this computation as comparing apples to oranges, but such a charge constitutes denial that the ratio of nominal debt to nominal GDP understates the wealth dilution caused by the government’s ability to issue and repay debt in nominal dollars. We know that inflation favors debtors, because debts can be repaid in inflated dollars.

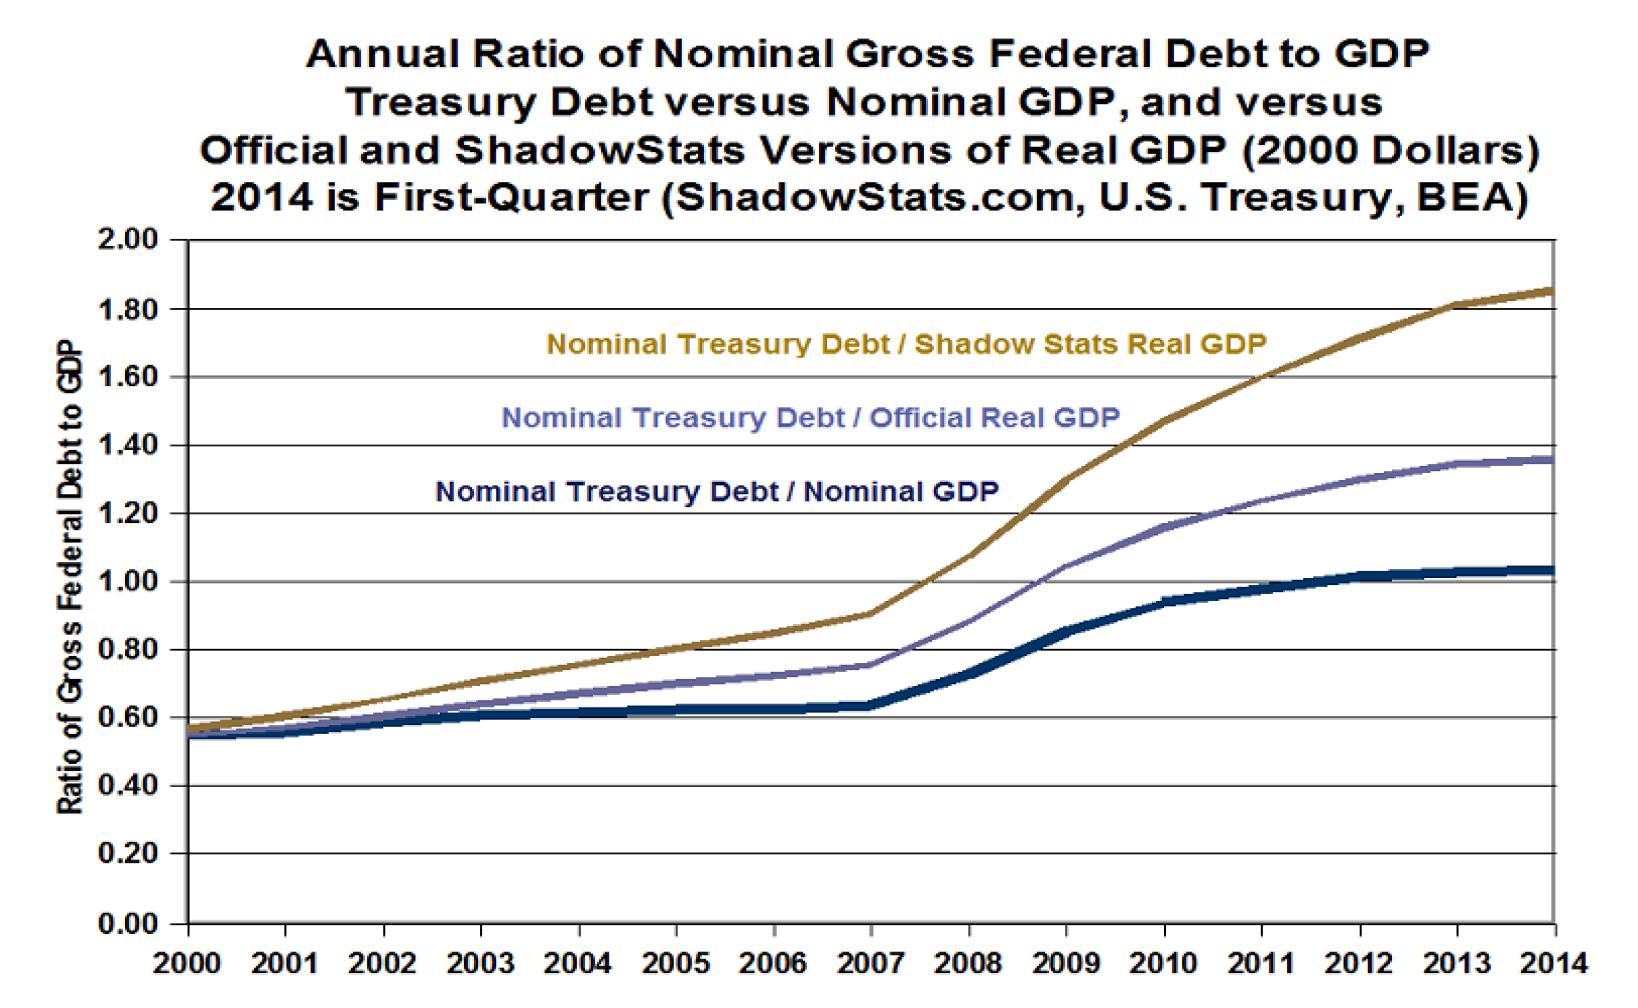
The graph below shows three different debt to GDP ratios. The bottom line is nominal debt to nominal GDP, the financial press ratio. The middle line is the ratio of nominal debt to the official measure of real GDP. The top line is the ratio of nominal GDP to Shadowstats’ corrected measure of real GDP that puts back in some of the inflation that is no longer included in official measures. The basis for this corrected measure is also 2000, but as the GDP number for 2000 is lower due to correction, this graph begins with the ratio at a slightly higher point.

The nominal debt to GDP ratio shows that as of the end of the first quarter of 2014 total US Treasury debt outstanding is 103 percent of US GDP.

The ratio of Treasury debt to official real GDP shows debt at 136% of GDP.

The ratio of debt to real GDP deflated with more a more realistic measure of inflation, one more in keeping with the experience of consumers, puts US public debt at 185% of GDP. In other words, the burden of US debt on the real economy is almost twice the burden that is normally perceived.

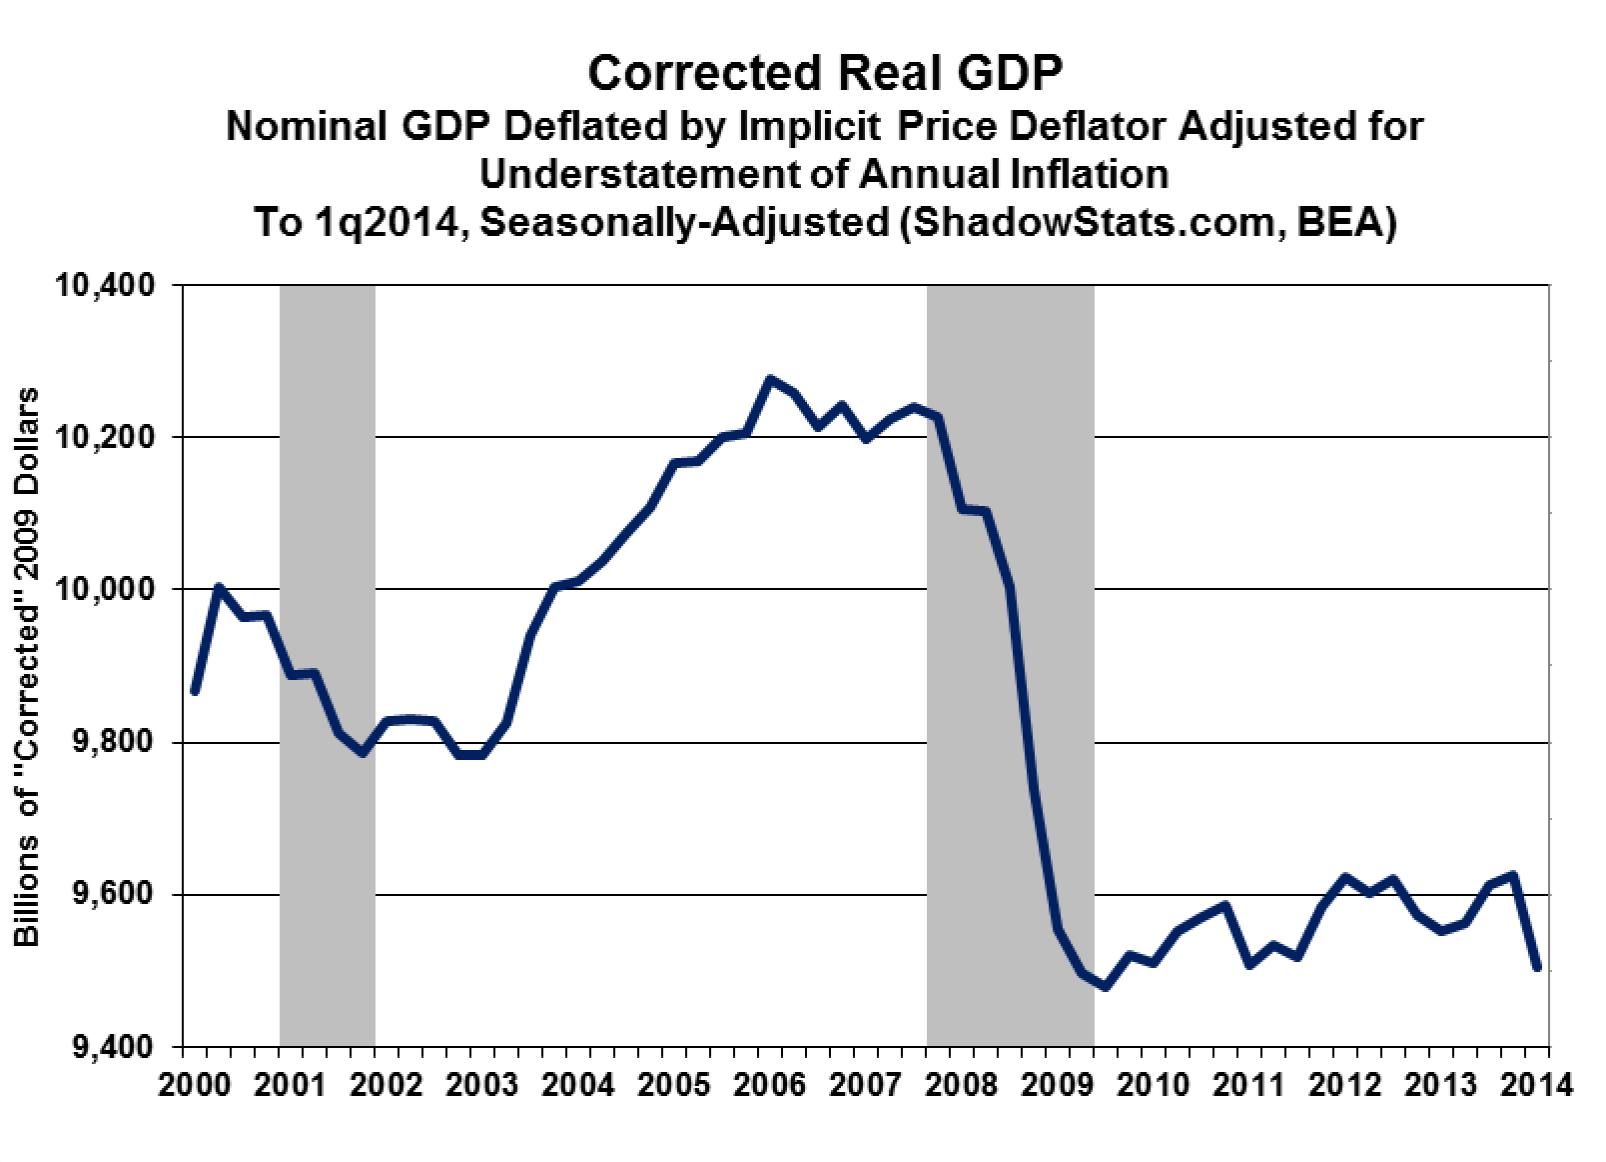
The Shadowstats adjustment we made to real GDP does not fully correct for what we believe has been a growing understatement of inflation since the 1980s. The adjustment we made corrects the implicit price deflator for a two-percentage point understatement of annual inflation due to hedonic distortion. Real GDP with this correction since 2000 looks like this:
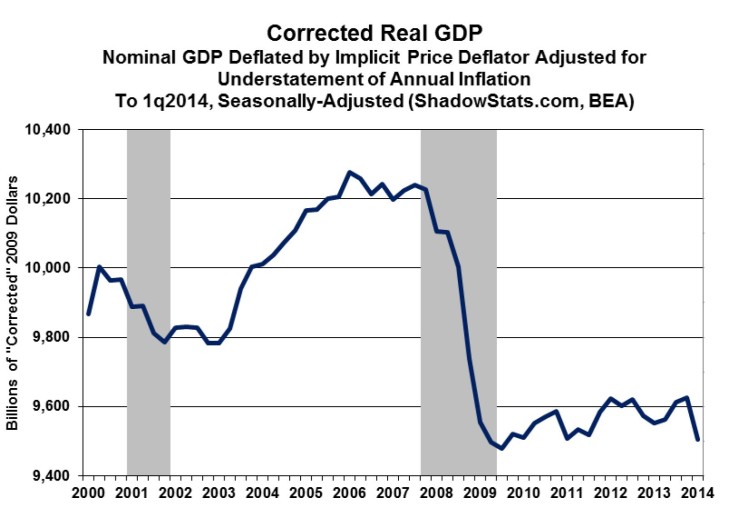

We have calculated the ratios of US public debt to nominal GDP and to two measures of real GDP. The ratios of debt to GDP would be much higher if we used total credit outstanding, or total public and private debt, and if we used the government’s unfunded liabilities. The fact seems clear that debt is a major and unappreciated issue for the US economy. The enormous debt, especially with the middle class economy largely offshored, implies substantially lower living standards for the 99 percent.

The first quarter contraction, especially our corrected number, implies a second quarter negative real GDP. In other words, the years of Quantitative Easing (money printing) by the Federal Reserve has not resulted in economic recovery from the 2008 downturn and has not prevented further contraction.

Massive money creation and huge fiscal deficits have protected the balance sheets of “banks too big to fail” but have harmed the American people. Retirees and pension funds have been deprived for years of interest income as the Federal Reserve engineered zero or negative interest rates for the sake of a handful of oversized banks.

The extraordinary creation of new dollars diluted the dollars held by peoples, companies, institutions, and central banks throughout the world, raising fears that the dollar would lose exchange value and its role as world reserve currency.

Washington’s use of financial sanctions to force other countries to bend to Washington’s will is causing countries to leave the dollar payments system. Russian President Vladimir Putin’s advisor has said that the dollar must be crashed as the only way to prevent US aggression. The Chinese have called for “de-americanizing the world.”

The imperialistic US Foreign Account Tax Compliance Act (FATCA), which comes into full force July 1, 2015, imposes such heavy reporting costs on foreign financial institutions that these institutions might opt out of dollar transactions. All together, the result could be a serious tumble in the value of the US dollar, more wealth contraction, higher inflation via import prices, and less US wealth available to support US debt.

In view of this reality, why is Washington pushing its puppet in Kiev toward war with Russia? Why is Washington pushing NATO to spend more money and build more bases on which to deploy more troops in the Baltics and Eastern Europe, especially when Washington’s contribution will be the largest part of the cost? Why is Washington re-entering the Middle East conflict that Washington began by inciting Sunni and Shia against one another? Why is Washington constructing new naval and air bases from the Philippines to Vietnam in order to encircle China?

If Washington is this unaware of its budget constraints and its financial predicament, it cannot be long before Americans experience economic catastrophe.

Friday, April 19, 2013

The Excel Depression

By PAUL KRUGMAN - NY Times
Published: April 18, 2013


In this age of information, math errors can lead to disaster. NASA’s Mars Orbiter crashed because engineers forgot to convert to metric measurements; JPMorgan Chase’s “London Whale” venture went bad in part because modelers divided by a sum instead of an average. So, did an Excel coding error destroy the economies of the Western world?

The story so far: At the beginning of 2010, two Harvard economists, Carmen Reinhart and Kenneth Rogoff, circulated a paper, Growth in a Time of Debt, that purported to identify a critical “threshold,” a tipping point, for government indebtedness.

Once debt exceeds 90 percent of gross domestic product, they claimed, economic growth drops off sharply.

Ms. Reinhart and Mr. Rogoff had credibility thanks to a widely admired earlier book on the history of financial crises, and their timing was impeccable. The paper came out just after Greece went into crisis and played right into the desire of many officials to “pivot” from stimulus to austerity. As a result, the paper instantly became famous; it was, and is, surely the most influential economic analysis of recent years.

In fact, Reinhart-Rogoff quickly achieved almost sacred status among self-proclaimed guardians of fiscal responsibility; their tipping-point claim was treated not as a disputed hypothesis but as unquestioned fact. For example, a Washington Post editorial earlier this year warned against any relaxation on the deficit front, because we are “dangerously near the 90 percent mark that economists regard as a threat to sustainable economic growth.” Notice the phrasing: “economists,” not “some economists,” let alone “some economists, vigorously disputed by other economists with equally good credentials,” which was the reality.

For the truth is that Reinhart-Rogoff faced substantial criticism from the start, and the controversy grew over time. As soon as the paper was released, many economists pointed out that a negative correlation between debt and economic performance need not mean that high debt causes low growth. It could just as easily be the other way around, with poor economic performance leading to high debt. Indeed, that’s obviously the case for Japan, which went deep into debt only after its growth collapsed in the early 1990s.

Over time, another problem emerged: Other researchers, using seemingly comparable data on debt and growth, couldn’t replicate the Reinhart-Rogoff results. They typically found some correlation between high debt and slow growth — but nothing that looked like a tipping point at 90 percent or, indeed, any particular level of debt.

Finally, Ms. Reinhart and Mr. Rogoff allowed researchers at the University of Massachusetts to look at their original spreadsheet — and the mystery of the irreproducible results was solved. First, they omitted some data; second, they used unusual and highly questionable statistical procedures; and finally, yes, they made an Excel coding error. Correct these oddities and errors, and you get what other researchers have found: some correlation between high debt and slow growth, with no indication of which is causing which, but no sign at all of that 90 percent “threshold.”

In response, Ms. Reinhart and Mr. Rogoff have acknowledged the coding error, defended their other decisions and claimed that they never asserted that debt necessarily causes slow growth. That’s a bit disingenuous because they repeatedly insinuated that proposition even if they avoided saying it outright. But, in any case, what really matters isn’t what they meant to say, it’s how their work was read:  

Austerity enthusiasts trumpeted that supposed 90 percent tipping point as a proven fact and a reason to slash government spending even in the face of mass unemployment.

So the Reinhart-Rogoff fiasco needs to be seen in the broader context of austerity mania: the obviously intense desire of policy makers, politicians and pundits across the Western world to turn their backs on the unemployed and instead use the economic crisis as an excuse to slash social programs.

What the Reinhart-Rogoff affair shows is the extent to which austerity has been sold on false pretenses. For three years, the turn to austerity has been presented not as a choice but as a necessity. Economic research, austerity advocates insisted, showed that terrible things happen once debt exceeds 90 percent of G.D.P. But “economic research” showed no such thing; a couple of economists made that assertion, while many others disagreed.  


Policy makers abandoned the unemployed and turned to austerity because they wanted to, not because they had to.

So will toppling Reinhart-Rogoff from its pedestal change anything? I’d like to think so. But I predict that the usual suspects will just find another dubious piece of economic analysis to canonize, and the depression will go on and on.

Thursday, April 18, 2013

How Much Unemployment Was Caused by Reinhart and Rogoff's Arithmetic Mistake?

Tuesday, 16 April 2013 | Beat the Press

That's the question millions will be asking when they see the new paper by the University of Massachusetts, Thomas Herndon, Michael Ash, and Robert Pollin. Herndon, Ash, and Pollin (HAP) corrected the spreadsheets of Carmen Reinhart and Ken Rogoff. They show the correct numbers tell a very different story about the relationship between debt and GDP growth than the one that Reinhart and Rogoff have been hawking.

Just to remind folks, Reinhart and Rogoff (R&R) are the authors of the widely acclaimed book on the history of financial crises, This Time is Different. They have also done several papers derived from this research, the main conclusion of which is that high ratios of debt to GDP lead to a long periods of slow growth. Their story line is that 90 percent is a cutoff line, with countries with debt-to-GDP ratios above this level seeing markedly slower growth than countries that have debt-to-GDP ratios below this level. The moral is to make sure the debt-to-GDP ratio does not get above 90 percent.

There are all sorts of good reasons for questioning this logic. First, there is good reason for believing causation goes the other way. Countries are likely to have high debt-to-GDP ratios because they are having serious economic problems.

Second, as Josh Bivens and John Irons have pointed out, the story of the bad growth in high debt years in the United States is driven by the demobilization after World War II. In other words, these were not bad economic times, the years of high debt in the United States had slow growth because millions of women opted to leave the paid labor force.

Third, the whole notion of public debt turns out to be ill-defined. Countries can sell off assets to pay down debts, would this avoid the R&R high debt twilight zone of slow growth? In fact, even the value of debt itself is not constant.Long-term debt issued in times of low interest rates will fall in value when interest rates rise. If there is a high debt twilight zone effect as R&R claim, then we can just buy back bonds at steep discounts and send our debt-to-GDP ratio plummeting.

But HAP tells us that we need not concern ourselves with any arguments this complicated. The basic R&R story was simply the result of them getting their own numbers wrong.

After being unable to reproduce R&R's results with publicly available data, HAP were able to get the spreadsheets that R&R had used for their calculations. It turns out that the initial results were driven by simple computational and transcription errors. The most important of these errors was excluding four years of growth data from New Zealand in which it was above the 90 percent debt-to-GDP threshold. When these four years are added in, the average growth rate in New Zealand for its high debt years was 2.6 percent, compared to the -7.6 percent that R&R had entered in their calculation.

Since R&R country weight their data (each country's growth rate has the same weight), and there are only seven countries that cross into the high debt region, correcting this one mistake alone adds 1.5 percentage points to the average growth rate for the high debt countries. This eliminates most of the falloff in growth that R&R find from high debt levels. (HAP find several other important errors in the R&R paper, however the missing New Zealand years are the biggest part of the story.)

This is a big deal because politicians around the world have used this finding from R&R to justify austerity measures that have slowed growth and raised unemployment. In the United States many politicians have pointed to R&R's work as justification for deficit reduction even though the economy is far below full employment by any reasonable measure. In Europe, R&R's work and its derivatives have been used to justify austerity policies that have pushed the unemployment rate over 10 percent for the euro zone as a whole and above 20 percent in Greece and Spain. In other words, this is a mistake that has had enormous consequences.

In fairness, there has been other research that makes similar claims, including more recent work by Reinhardt and Rogoff. But it was the initial R&R papers that created the framework for most of the subsequent policy debate. And HAP has shown that the key finding that debt slows growth was driven overwhelmingly by the exclusion of 4 years of data from New Zealand.

If facts mattered in economic policy debates, this should be the cause for a major reassessment of the deficit reduction policies being pursued in the United States and elsewhere. It should also cause reporters to be a bit slower to accept such sweeping claims at face value.

(Those interested in playing with the data itself can find it at the website for the Political Economic Research Institute.)

Tuesday, February 19, 2013

Still Clueless About the Economy

The Debt-to-GDP Nonsense
by DEAN BAKER


The latest fad in Washington economic policy debates is arguing over the level at which the government should stabilize the debt-to-GDP ratio. The doves are okay with a debt-to-GDP ratio of 73 percent or even 76 percent. The hawks want 60 percent or even less. This is the most fun since the same crew was debating over the year when we would pay off the national debt back in 2000. The good times just keep coming.

If you think that this is an incredibly silly debate and that our leading policymakers don’t have a clue about how the economy works, you’ve got the picture right. Remember, these are people who could not see the $8 trillion housing bubble whose collapse wrecked the economy. They haven’t learned much economics in the last five years.

The argument over the debt-to-GDP ratio is especially annoying because it shows these people don’t have the faintest clue what they are talking about. There are all sorts of obvious reasons why debt is not a good measure of the burden that we are placing on future taxpayers.

For example, the government has a huge amount of assets that it could sell at any time and thereby reduce its debt. The Institute for Energy Research, an industry-funded research outfit, claims the government owns more than $120 trillion in energy resources. Let’s say they exaggerated by a factor of ten, leaving us $12 trillion in assets.

If we sold off half of these resources it would net the government $6 trillion. This would reduce our debt by almost 40 percentage points of GDP. That should make even the most ardent deficit hawk happy.

Of course it’s not just physical assets that the government can sell. The government gives out monopolies in various areas that have enormous value. That is what patents and copyrights are. The rents earned from these and other forms of intellectual property run into many hundreds of billions of dollars a year. In prescription drugs alone they are close to $250 billion a year.

The government could always sell off more monopolies in order to reduce its debt-to-GDP ratio. A flow of revenue equal to what the pharmaceutical industry gets from its patent monopolies could easily be worth $2-3 trillion. That would go very far toward reducing our debt-to-GDP ratio.

These sorts of monopolies will impose large costs on the economy in the future, leading to distortions and rent-seeking. That would be a good reason not to go in this direction. But the debt-to-GDP crew doesn’t ask questions about how well off the country is, they just want a lower debt-to-GDP ratio. And selling monopolies will get us there.

However there is an even more simple and completely painless path to a lower debt-to-GDP ratio. The price of long-term bonds rises when interest rates fall. The price of these bonds falls when interest rates rise.

This latter point is important. Currently interest rates are at near post-war lows. We have issued 10-year Treasury bonds at interest rates close to 1.5 percent and 30-year bonds at interest rates of 2.75 percent. The Congressional Budget Office, along with other official forecasters, project that interest rates will rise sharply over the next few years.
If interest rates rise as projected, then the price of these long-term bonds fall sharply. For example, if the interest rate on 30-year bonds rises to 6 percent by 2016, then the price of a 30-year bond issued at 2.75 percent in 2012 will have fallen by more than 40 percent. This means that if the government issued $100 billion in bonds at the low 2012 rate it could buy them back for less than $60 billion in 2016, instantly eliminating $40 billion of government debt. (Allan Sloan made this point in a slightly different context).

The government can follow this practice of buying up large numbers of bonds issued at low interest rates to eliminate much of the debt it has incurred. Although the government’s debt-to-GDP ratio is reaching heights not seen since the years just after World War II, the ratio of interest on the debt-to-GDP is at post-World War II lows.

This means that when interest rates rise, there will be a sharp decline in the market value of government debt, allowing for massive amounts of debt reduction simply by buying back debt at the discounted value that the CBO is effectively projecting. We should have little problem shaving 15-20 percentage points off our debt-to-GDP ratio through such purchases, hitting whatever target the deficit hawks have decided is necessary.

Of course this is ridiculous. Buying back debt at discounted prices will not change our interest burden at all. But we live in a world where the folks deciding economic policy have now decided that the debt-to-GDP ratio will be the new guidepost for economic policy.

If it seems hard to believe that the very well-credentialed people who control economic policy can be utterly clueless about the economy, remember these are people that missed a $10 trillion stock bubble. They also missed an $8 trillion housing bubble. The same cast of characters who have been getting it completely wrong over the last 15 years are still calling the shots. And there is no reason to believe that their understanding of the economy has improved as a result of their past mistakes.

Tuesday, July 17, 2012

The Real Libor Scandal

by PAUL CRAIG ROBERTS and NOMI PRINS
 
According to news reports, UK banks fixed the London interbank borrowing rate (Libor) with the complicity of the Bank of England (UK central bank) at a low rate in order to obtain a cheap borrowing cost.  The way this scandal is playing out is that the banks benefitted from borrowing at these low rates. Whereas this is true, it also strikes us as simplistic and as a diversion from the deeper, darker scandal.Banks are not the only beneficiaries of lower Libor rates.  Debtors (and investors) whose floating or variable rate loans are pegged in some way to Libor also benefit.  One could argue that by fixing the rate low, the banks were cheating themselves out of interest income, because the effect of the low Libor rate is to lower the interest rate on customer loans, such as variable rate mortgages that banks possess in their portfolios. But the banks did not fix the Libor rate with their customers in mind. Instead, the fixed Libor rate enabled them to improve their balance sheets, as well as help to perpetuate the regime of low interest rates. The last thing the banks want is a rise in interest rates that would drive down the values of their holdings and reveal large losses masked by rigged interest rates.

Indicative of greater deceit and a larger scandal than simply borrowing from one another at lower rates, banks gained far more from the rise in the prices, or higher evaluations of floating rate financial instruments (such as CDOs), that resulted from lower Libor rates. As prices of debt instruments all tend to move in the same direction, and in the opposite direction from interest rates (low interest rates mean high bond prices, and vice versa), the effect of lower Libor rates is to prop up the prices of bonds, asset-backed financial instruments, and other “securities.” The end result is that the banks’ balance sheets look healthier than they really are.

On the losing side of the scandal are purchasers of interest rate swaps, savers who receive less interest on their accounts, and ultimately all bond holders when the bond bubble pops and prices collapse.

We think we can conclude that Libor rates were manipulated lower as a means to bolster the prices of bonds and asset-backed securities.  In the UK, as in the US, the interest rate on government bonds is less than the rate of inflation.  The UK inflation rate is about 2.8%, and the interest rate on 20-year government bonds is 2.5%. Also, in the UK, as in the US, the government debt to GDP ratio is rising. Currently the ratio in the UK is about double its average during the 1980-2011 period.

The question is, why do investors purchase long term bonds, which pay less than the rate of inflation, from governments whose debt is rising as a share of GDP?  One might think that investors would understand that they are losing money and sell the bonds, thus lowering their price and raising the interest rate.

Why isn’t this happening?

Despite the negative interest rate, investors have been making capital gains from their Treasury bond holdings, because the prices were rising as interest rates were pushed lower.
What was pushing the interest rates lower?

The answer is even clearer now.  Wall Street has been selling huge amounts of interest rate swaps, essentially a way of shorting interest rates and driving them down.  Thus, causing bond prices to rise.

Secondly, fixing Libor at lower rates has the same effect. Lower UK interest rates on government bonds drive up their prices.

In other words, we would argue that the bailed-out banks in the US and UK are returning the favor that they received from the bailouts and from the Fed and Bank of England’s low rate policy by rigging government bond prices, thus propping up a government bond market that would otherwise, one would think, be driven down by the abundance of new debt and monetization of this debt, or some part of it.

How long can the government bond bubble be sustained?  How negative can interest rates be driven?

Can a declining economy offset the impact on inflation of debt creation and its monetization, with the result that inflation falls to zero, thus making the low interest rates on government bonds positive?

According to his public statements, zero inflation is not the goal of the Federal Reserve chairman.  He believes that some inflation is a spur to economic growth, and he has said that his target is 2% inflation.  At current bond prices, that means a continuation of negative interest rates.

The latest news completes the picture of banks and central banks manipulating interest rates in order to prop up the prices of bonds and other debt instruments.  We have learned that the Fed has been aware of Libor manipulation  (and thus apparently supportive of it) since 2008. Thus, the circle of complicity is closed. The motives of the Fed, Bank of England, US and UK banks are aligned, their policies mutually reinforcing and beneficial. The Libor fixing is another indication of this collusion.

Unless bond prices can continue to rise as new debt is issued, the era of rigged bond prices might be drawing to an end. It would seem to be only a matter of time before the bond bubble bursts.

Tuesday, May 15, 2012

Deficit Reduction: The Great Distraction


by Dean Baker
 
 
This is the week of the third annual Deficit Fest, the event sponsored by Wall Street billionaire Peter G. Peterson. At this event, many of the people most responsible for the current downturn come together to tell us why we should be worried about the deficit at a time when 45 million people are unemployed, underemployed or have given up looking for work altogether and millions face the prospect of losing their homes.

Past deficit fests included exchanges where Peter Peterson and former Treasury Secretary and Citigroup honcho Robert Rubin mused about their comparative net worth. We also got to witness President Clinton bemoan the fact that the Democratic and Republican leadership in Congress teamed up to prevent him from cutting Social Security. Had Clinton gotten his way, millions of seniors would be getting by on Social Security checks that are more than 10 percent smaller than what they now receive.

Peterson is also known for his sponsorship of the "Economic Sleepwalk" tour, which was officially billed as the "Fiscal Wakeup" tour. This involved sending a group of policy wonks around the country to complain about the budget deficit at a time when the housing bubble was growing to ever more dangerous levels. While some of us were doing our best to warn of the imminent disaster, Peterson was using his money and political connections to dominate media space at a time when the country's debt-to-GDP ratio was actually falling.

But why harp on the past? We should be focused on the future.

And one of the items that this group would like to see in our future is a deficit deal like the one proposed by Erskine Bowles and former Senator Alan Simpson, the co-chairs of President Obama's deficit commission. (The Bowles-Simpson plan is inaccurately referred to on the commission's website as a report of the commission, ironically on a page titled "Moment of Truth." In fact, it is only the report of the co-chairs since it did not receive the 14 votes needed to be approved as an official report of the commission.)

This plan includes a wide range of budget cuts, including cuts to Social Security and Medicare. It would reduce the annual Social Security cost-of-living adjustment by 0.3 percent, which would lower lifetime benefits by an average of more than 3 percent. It would also raise the retirement age for Social Security. To balance these cuts to programs that benefit tens of millions of ordinary workers, Bowles and Simpson would cut the corporate tax rate from 35 to 28 percent and would lower the tax rate paid by the very wealthy from 40 percent to 28 percent. While these reductions in tax rates are supposed to be offset by the elimination of loopholes that benefit the wealthy, people have good cause for skepticism.

If these policies seem out of step with the interests of ordinary workers, it should not be surprising given their parentage. Erskine Bowles in particular could be the poster boy for everything that is wrong in national politics today. Bowles rose to become chief of staff in the Clinton White House in the 90s. He then twice competed unsuccessfully for Senate seats in North Carolina. As a consolation prize he became the President of the University of North Carolina.

Since it is hard to make ends meet on a university president's salary these days, Mr. Bowles also did a little bowling for dollars. He moonlighted as a director on corporate boards, serving stints at Morgan Stanley, the huge Wall Street investment bank, General Motors (until it went bankrupt), and most recently Facebook.

Being a director on a corporate board typically involves attending 4-8 meetings a year. For this, directors receive several hundred thousands of dollars in compensation. For example, in 2008 Erskine Bowles received $335,000 in compensation for his work on Morgan Stanley's board.

This year is noteworthy because Morgan Stanley's dealings in mortgage-backed securities brought it to the edge of bankruptcy in the fall of 2008. It was only saved from disaster by the generous intervention of Ben Bernanke. He allowed the bank to change its status in the middle of the post-Lehman crisis, and become a bank holding company. This gave it the protection of the Fed and the FDIC.

Given this near brush with death, shareholders might ask what Mr. Bowles did for the $335,000 that we paid him. "We" is appropriate in this sentence, since much of the public has a stake in Morgan Stanley either through an index fund in a 401(k) that likely holds some of the company's stock or the defined benefit pensions that most state and local governments still have for their workers.

In fact, we should be asking this question of directors more generally. When shareholders voted "no" last month on the pay package of Citigroup's CEO, Vikram Pandit, they were saying that the company's well-paid board was not doing its job. These directors were getting paid $250,000 each year for just a few days' work. Their job is precisely to prevent such outlandish pay packaged for top management.

The failure of these highly paid directors is a major national problem. Their compensation looks more like payoffs than paychecks. After their palms get greased, they look the other way when the CEOs walk away with tens or even hundreds of millions of dollars of the shareholders' money. And the outsized pay of the CEOs corrupts pay scales throughout the economy. Even heads of charities can now command pay packages in excess of $1 million a year.

Anyhow, when we hear Erskine Bowles and his friends rant about the deficit this week, we should remember that once again they are distracting the public from the country's real problems. And this crew is at the center of those problems; it is not the solution.

Wednesday, March 21, 2012

The Real Agenda Behind Paul Ryan’s Deficit-Slashing Mania

Tax Cuts for Corporations and the Super-Rich; Budget Cuts for Medicare and Medicaid
by DEAN BAKER

If you want to see House Budget Committee Chairman Paul Ryan sanctimoniously excuse himself and his friends for missing the most predictable economic crisis in the history of the world, you now have the opportunity: In a YouTube video produced by his staff, Ryan tells viewers that the crisis called by the collapse of the housing bubble caught “us” by surprise.

Well, it didn’t actually catch us by surprise. Some of us had been warning about the potential damage caused by the collapse of the bubble since 2002. We repeatedly tried to warn of the dangers of the housing bubble in whatever forum we had.

It was easy to see that the housing market was hugely over-valued and that at some point it would collapse, just as the stock bubble had collapsed in 2000-2002. It was also easy to see that its collapse would have a devastating impact on the economy.
The bubble was driving the economy both directly by propelling a construction boom and indirectly through the impact of housing bubble wealth on consumption. When the bubble burst, there would be nothing to replace this bubble driven-demand. It would be necessary to run the sort of large government budget deficits that we have seen the last four years in order to sustain the economy and keep unemployment rate out of the double digits.

All of this was 100 percent predictable and predicted. However Representative Ryan wants to give himself the blanket “who could have known” amnesty because he and his Wall Street friends chose to ignore the people who were giving the warnings.

Ryan should apply a variation on the sanctimonious lines in his video to himself:
“Imagine being warned about an economic crisis that would throw more than 10 million people out or work and cause millions to lose their home and doing nothing. Imagine that our politicians in Congress and the White House chose to do nothing while there was still time because it would have been bad politics to upset the Wall Street banks who were making so much money. They instead chose to ignore the warnings. That is immoral.”
While some of us were putting in overtime and missing sleep to try to warn about the dangers of the housing bubble, Representative Ryan and his cronies were whining about a budget deficit that was almost non-existent. The budget deficits that the government was running in the years just before the collapse of the housing bubble were less than 2.0 percent of GDP. The debt-to-GDP ratio was actually falling. We could have run deficits of this magnitude forever.

After contributing through his negligence to the worst economic crisis since the Great Depression, Representative Ryan has the gall to imply that the people who don’t like his plan are immoral. While we don’t yet know the specifics of his new plan this year, we do know what he put on the table last year.

According to projections from the Congressional Budget Office, that plan would have raised the cost to the country of buying Medicare-equivalent insurance policies by $34 trillion over Medicare’s 75-year planning period. It also would have led to huge cuts in Medicaid, denying health care to children as well as other budget cuts that would have worsened the situation of low and moderate-income children.

And to offset these cuts Representative Ryan promised big tax breaks to corporations and the richest people in the country. His budget lowered the tax rate on both to just 25 percent.
If we can skip the sanctimony let’s just say what every budget wonk knows to be true. We don’t have a budget problem; we have a health care cost problem. If per person health care costs in the United States were in line with those in any other wealthy country we would be looking at huge budget surpluses, not deficits.

The answer lies not in cutting back and/or eliminating Medicaid and Medicare, but in fixing the health care system. That’s the simple truth and to try to contend otherwise is immoral, Representative Ryan.

Friday, July 23, 2010

One Economic Chart That You Should Permanently Burn Into Your Memory

By Michael Snyder - BLN Contributing Writer | Published on 07-23-2010

Today most Americans are completely obsessed with the silliest of things.  They wonder how Lindsay Lohan is going to fare in jail and they agonize over who LeBron James is going to play basketball for.  But when it comes to the things that really matter, most Americans are completely clueless.  For example, while most Americans would agree that we are experiencing difficult economic times right now, most of them would also argue that our economic system is in fundamentally good shape and that things will get back to "normal" at some point.

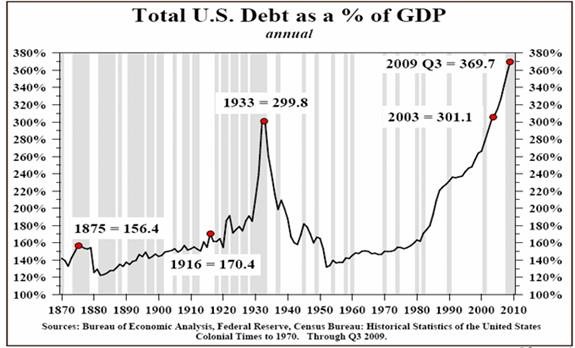
Those of us who are trying to warn America of the impending economic nightmare are dismissed as "doom and gloomers" and "conspiracy theorists". But of course, as with so many things, the passage of time will tell who was right and who was wrong.  Below there is a chart that I want all of you to burn into your memory.  It is a chart of total U.S. debt as a percentage of GDP from 1870 until 2009.  This chart clearly and succinctly communicates the horror of the debt bubble that we are currently dealing with. When this debt bubble pops, it is going to make the Great Depression look like a Sunday picnic.

As you can see from the chart below, the total of all debt (government, business and consumer) is now somewhere in the neighborhood of 360 percent of GDP.  Never before has the United States faced a debt bubble of this magnitude....


Most of us were not alive during the Great Depression, but those who were remember how incredibly painful it was for America to de-leverage and bring the economic system back into some type of balance.

So if our current debt bubble is far worse, what kind of economic horror is ahead for us?

But the truth is that we are facing some circumstances that even the folks back during the Great Depression did not have to deal with....
1 - Back in the 1930s, tens of millions of Americans lived on farms or knew how to grow their own food. Today the vast majority of Americans are totally dependent on the system for even their most basic needs.
2 - A vast horde of Baby Boomers is expecting to retire, and the "Social Security trust fund" has nothing but 2.5 trillion dollars of government IOUs in it. According to an official U.S. government report, rapidly growing interest costs on the U.S. national debt together with spending on major entitlement programs such as Social Security and Medicare will absorb approximately 92 cents of every dollar of federal revenue by the year 2019. This is a financial tsunami the likes of which Americans back in the 1930s could never have even dreamed of.
3 - American workers never had to compete for jobs with workers on the other side of the world back in the 1930s. But today, millions upon millions of our jobs have been "outsourced" to China, India and a vast array of third world nations where desperate workers are more than happy to slave away for big global corporations for less than a dollar an hour. How in the world are American workers supposed to compete with that?
4 - Back in the 1930s, there was nothing like the gigantic derivatives bubble that hangs over us today. The total value of all derivatives worldwide is estimated to be somewhere between 600 trillion and 1.5 quadrillion dollars. The danger that we face from derivatives is so great that Warren Buffet has called them "financial weapons of mass destruction". When this bubble pops there won't be enough money in the entire world to fix it.
5 - During the Great Depression, the United States economy was relatively self-contained. But today we truly do live in a global economy. Unfortunately that means that a severe economic crisis in one part of the world is going to affect us as well. Right now, the United States is far from alone in dealing with a massive debt crisis. Greece, Spain, Italy, Hungary, Portugal and a number of other European nations are in real danger of actually defaulting on their debts. Japan (the third biggest economy in the world) is on the verge of complete and total economic collapse. So what happens to the U.S. economy when the dominoes start to fall?
The truth is that by almost any measure, we are in worse economic condition than we were right before the beginning of the Great Depression. We have been living way beyond our means and the debts we have been piling up are clearly not anywhere close to sustainable.

Did you think that we could just continue to run deficits equal to 10 percent of GDP forever?

Of course not.

The U.S. economy is being driven off a cliff, but America's "ruling class" has insisted all along that they know better than we do.

But the truth is that in the final analysis it is not us that they care about.

What they do actually care about is getting more money and more power for themselves and for other members of the ruling class. Today, 10,000 people make 30% of the total income in the United States each year.

That leaves 70% of the pie for the remaining 99.99% of us to divide up.

The reality is that however you want to slice it, the U.S. economic system is broken. However, considering the fact that America's ruling class has a stranglehold on both major political parties, we are not likely to see any fundamental changes any time soon.

That is very unfortunate, because time is running out on the U.S. economy.

Sunday, July 11, 2010

Moving Further from the Common Good

by Caroline Arnold | Sunday, July 11, 2010 | the Kent Ravenna Record-Courier (Ohio)
If we have a pool we want to fill with water, does it make more sense to turn on a faucet and fill it up, or to hire pilots to seed the clouds and try to make it rain? Cloud-seeding, like our current approach to dealing with unemployment, would be discredited "trickle down" theory with a vengeance! --"Let's End Unemployment Once and for All" by Paul deLespinasse
In the past thirty years we have been persuaded by a Grand Fable that the central freedom of democratic capitalism is the freedom of the rich to broker their money to get richer, because that makes everyone richer.

There are some satellite myths: only the private sector creates jobs and wealth; deficits are always bad and a burden on our children; poor people have to "take responsibility" for their own health, welfare and retirement; people are poor because they are lazy, selfish, stupid, or greedy; the rich must be free of taxes so they can create more jobs and then we can tax the "little people" who do the work; private schools provide better education than public schools; private capital is necessary to underwrite the innovations in science, technology and manufacturing necessary to meet the present challenges of food, energy, and natural resources. Any questioning of these myths is met with accusations of "socialism" or "nanny state."

So we have a health insurance industry that doesn't provide any health care, diagnosis, surgery, nursing, or therapy and doesn't do R & D. They only sit in the middle and broker the cash between you and your health care providers, while skimming off about a third of that cash in profits.

So taxpayers underwrite building nuclear power plants because private entrepreneurs won't risk their fortunes on such hazardous ventures.

So big oil and coal mining companies generate huge profits for their shareholders while the costs - of both success and failure - are paid by taxpayers and consumers, and the risks to life and livelihood are borne by countless humans and wild creatures.

So we hear calls for raising the age to collect Social Security to 70 in order to save money on the deficit, even though a major consequence will be that fewer jobs are freed up for young people entering the job market.

So we are constantly pushed to "Go Green" by paying bills online. It may save some trees; even more it will save money for profits - not so much from paper and postage as from jobs - jobs of people with mortgages and children and aging parents.

So large private contractors profit from wars supported by the taxes of "little people" and the lives of youth who can't find jobs.

So now, although there are presently five unemployed workers for every job opening, Congress will not pass an unemployment benefits bill that would increase the debt-to-GDP ratio from 65.3% to 65.4% by the end of 2011.

Congressional Republicans seem to have hitched their wagons to unemployment in order to protect the tax cuts and profits of the rich, to preserve their ability to profit from Earth's resources and from weapons and wars of empire, and to keep the unemployed out of a job and broke until they vote for more Republicans. Likely outcomes: more unemployment, further declines in government revenues, more public costs for emergency health care, crime, domestic violence, and prisons, and more homelessness and hunger.

Predatory capitalism also has major goals for education: access to public money (local or national taxes) to make public schools into a new market for corporate development, and to get local school boards and teachers' unions out of all decision-processes for schools.

But it's not just the rich:. A dissatisfied letter-to-the-editor writer recently complained "[Politicians] care about power, greed, personal agendas and getting their way, regardless of their impact on people" and then went on to suggest that each person ask "Am I better off than I was in 2008? Have my taxes gone up? Is my income down? Do I still have a job? Do I feel safer? Have I lost some of my freedoms? "

To me, those questions are exactly about power, greed, personal agendas and getting one's way - not least because they are all expressed in terms of "I" and "my".

Where is the concern for the impact on others? Are our neighbors better off? Our community? The people of Afghanistan? Is everyone paying more taxes, or just those without tax loopholes or offshore tax havens? Has everyone's income increased? Or kept pace with the cost of living? Are there jobs in our communities? Are we all safer - including people who work in coal mines, or on the coasts of the Gulf of Mexico? Have we restricted some freedoms without due process of law?

Seeding the clouds of the rich to make it rain and fill all pools hasn't worked yet, but we seem to be further than ever from any consensus that we must maintain a public water supply from fair taxes, and use it for the common good: to invest in jobs, medical care, education, renewable energy and public infrastructure.

Worse, though consensus is emerging that the war in Afghanistan is not working, no one seems willing to stop that off-budget drain on our tax revenues and divert the flow back into our communities and nation.