Saturday, September 17, 2011

Signs God Is Furious With the Right


Editor's note: the following is satire... for the most part.

Why is it that whenever disaster strikes, right-wing religious nuts seem to have all the fun? Some might say it's just because they're sadists, but they always seem to find the silver lining. 9/11? God's calling on America to repent! (No, not for it's foreign policy, you dummy!) Hurricane Katrina? It was that darned homosexual parade the organizers forgot to tell anyone about!

Whatever disaster strikes, there's always an up-side in religious rightland, always somebody to point the finger at with glee. How come they get all the fun?

So when the East Coast got a one-two punch last month, earthquake-hurricane within a few days of one another, it got me thinking. When another hurricane followed up afterward, it was more than I could bear. And so, I offer you a list of God's Top 10 Targets from a not-so-right-but-possibly-more-righteous point of view.

There are at least three different ways to approach this subject, and we have examples of all three. First is to identify specific target groups for repeated offenses—sinners who just won't mend their ways. Second is to identify geographic targets for specific offenses—sin city or state, as the case may be. Third is to identify specific individuals.

1. Republicans, for bearing false witness.
It's not just one of the Ten Commandments -- the Bible has repeated warnings against slander, false testimony and plain old lying. But Republicans apparently think that God was talking to somebody else—the exact opposite of their usual assumption—especially since Barack Obama arrived on the scene. Obama was born in Kenya, he is a Muslim, he's a socialist, a Marxist, a fascist, he hates white people (like his mom and his grandparents), he hangs out with terrorists. It goes on and on and on.

God has repeatedly told them not to act like this—yet they pay Him no mind. It's not just Obama, either. When it comes to science, things get just as bad, be it evolution, global warming, reproductive health, or gender orientation; when the science isn't on their side, the lying and slander take up the slack. It's not just that the science is against them, you see. Scientists are fraudsters; they are always conspiring against God and his people, according to some of the more whacked out types—like GOP senators, for example. God may have a great deal of patience, but when folks start trying to drag Him into the mix, that's when the earthquakes and hurricanes begin.

2. The Religious Right, for ignoring Jesus on the separation of church and state.
More than 1,600 years before John Locke and 1,700 years before Thomas Jefferson weighed in on the subject, Jesus said, “Render therefore unto Caesar that which is Caesar’s and unto God those things which are God’s.” (What's more, he said that, in part, as a way of opting out of a tax revolt!) But the Religious Right defiantly continues to oppose Him. God's been extremely patient with them over the years, but that patience has finally run out, as the most anti-separationist elements of the Religious Right—known as dominionists—have come increasingly to the fore. Some might say they're embarrassing Him personally. Others will say it's starting to get really dangerous. Whatever the reason, God's had enough.

3. The nativist right and the GOP, for a rash of anti-immigrant laws.
“Thou shalt neither vex a stranger, nor oppress him: for ye were strangers in the land of Egypt.” Exodus 22:21 could not be clearer—unless, of course, we switched from the King James Bible to the New International Version: “Do not mistreat an alien or oppress him, for you were aliens in Egypt.”

But for some in the GOP, them's fightin' words. All they can think about is disobeying God. They are positively possessed with the Satanic spirit of disobedience. It began with Arizona's SB-1070 last year. And while a number of states followed Arizona's lead with anti-immigrant laws of their own, the most notorious was Alabama, which faced "a historic outbreak of severe weather" in April.

The same day the law was signed, Alabama’s Episcopal, Methodist and Roman Catholic churches filed a separate lawsuit, claiming the law unconstitutionally interferes with their right of religious freedom. Church leaders said the law “will make it a crime to follow God’s command.” Among other things, the suit said, “The bishops have reason to fear that administering of religious sacraments, which are central to the Christian faith, to known undocumented persons may be criminalized under this law.”  If criminalizing Christian sacraments isn't inviting divine retribution, what is?

4. The predatory lending industry and all who enable them. 
There are numerous Bible passages condemning usury. Typical of these is Exodus 22:25: "If you lend money to one of my people among you who is needy, do not be like a moneylender; charge him no interest." Naturally, the whole of modern capitalism is built on ignoring a broad reading of this. But predatory lending is a particularly egregious form of defiance. It's proved rather costly to our country as well.

A Wall Street Journal article on December 31, 2007 reported that Ameriquest Mortgage and Countrywide Financial, two of the largest U.S. mortgage lenders, spent $20.5 million and $8.7 million respectively in political donations, campaign contributions, and lobbying activities between 2002 and 2006 in order to defeat anti-predatory lending legislation. Such practices contributed significantly to the financial crisis that plunged us into the Great Recession. But it seems that wasn't a clear enough lesson, especially since those who lobbied most intensely benefited most from the bailouts as well, according to an IMF study. So earthquakes and hurricanes are an old school, Old Testament way for God to make his point.

5. The GOP, for its contempt for the poor. 
For more than half a century, the GOP has attacked Democrats and liberals for their concern for the poor. At least since the 1980s, the neo-liberal wing of the Democratic Party has tried to distance themselves from the poor, and reposition the party as defenders of the middle class, instead. The GOP has responded with policies to impoverish the middle class as well, so that they can be safely demonized, too.

But the GOP's venom for all but the wealthy has reached new heights during the Great Recession. Not only should those who caused the crisis be taken care of while all others suffer—far too many national Democratic politicians seem to agree on that one—but a renewed rhetoric of contempt for the poor has emerged, in direct contradiction to what Jesus said, in Luke 6:20: “Blessed are you who are poor, for yours is the kingdom of God."

Increasingly, it seems, Republicans don't think poor people are even human. In January 2010, South Carolina Lt. Governor Andre Baurer (R) compared poor people to stray animals: He told an audience that his grandmother told him "as a small child to quit feeding stray animals. You know why? Because they breed." He compared this to government assistance, which he said is "facilitating the problem if you give an animal or a person ample food supply. They will reproduce, especially ones that don't think too much further than that.

And so what you've got to do is you've got to curtail that type of behavior. They don't know any better." Then, in early August, Nebraska Attorney General Jon Bruning, the frontrunner for the GOP senate nomination, compared poor people to scavenging racoons. Talk like that is what causes earthquakes and hurricanes.

6. Privatized public utilities, for the worship of Mammon. 
Public utilities are natural monopolies, totally unsuited to private enterprise, since there is no competitive marketplace. This, of course, makes them perfect targets for monopoly capitalists—Mammon's greatest worshipers.

Against them, God struck a mighty blow. In Mansfield, Massachusetts, which has had its own municipal power service since 1903, electrical service was restored for most customers within 24 hours after Irene hit, even though 4,000 out of 9,500 households had lost power—quite unlike what happened to nearby communities served by a commercial outfit. According to a local report, the storm “uprooted old trees and knocked down utility lines all over town.”

“Unlike homes and businesses in Easton, Norton and Foxboro, however, local customers did not have to wait for National Grid to respond with crews or listen to a recording on the telephone.... [M]uch of Easton waited three days for power to return and areas of communities such as Foxboro are still in the dark.” According to another report, about Foxborough, “The outrage expressed... is similar to the movie Network in the scene where people flung open their windows and said, 'I'm as mad as hell, and I'm not going to take this anymore.'”

Then there are a couple of geographically specific targets:

7. Virginia. 
Virginia was the site of the earthquake's epicenter and the second state where Irene made landfall, so the state is a target-rich environment.

There's House Majority Leader Eric Cantor. On God's bulls-eye scale, the epicenter near Mineral, Virginia is in Cantor's district—a direct hit. And in budget negotiations this year, Cantor's contempt for the poor came through loud and clear. He's been the most aggressive congressional leader when it comes to budget-cutting and pushing the economy as hard as possible over the cliff. Then, after the earthquake hit, Cantor said any federal relief would have to be offset with spending cuts, and quipped, “Obviously, the problem is that people in Virginia don’t have earthquake insurance.” He reiterated his demand for offsetting cuts when Hurricane Irene hit shortly afterward—even though he voted against such a provision after Tropical Storm Gaston hit the Richmond area in 2004.

Then there's Virginia Attorney General Ken Cuccinelli. No way he escapes God's wrath. Cuccinelli's widely criticized witch-hunt against eminent climate scientist Michael Mann represents the most extreme right-wing attack on the mythical “climate-gate” scandal, which consisted primarily of scientists making snide remarks about ignoramuses like Cuccinelli. He's all wrapped up in sin of bearing false witness. Which is where Hurricane Irene comes in—although it surely doesn't help that Cuccinelli is suing to keep people sick, and has told Virginia's colleges and universities that they can't ban anti-gay discrimination.

And, of course, Virginia Governor Bob McDonnell has tried to have it both ways with God, as well as with the people of Virginia. On the one hand, all the way back in 1989, he wrote a Christian Reconstructionist M.A. thesis, “The Republican Party’s Vision for the Family: The Compelling Issue of the Decade” at the College of Law at Pat Robertson’s Regent University. McDonnell's authorship of the thesis came to light during his 2009 campaign for governor, but because the establishment is in deep denial about Dominionism in general, and Christian Reconstructionism in particular, the full weight of his thesis never really sunk in. On the other hand, McDonnell has tried very assiduously to walk away from that past, given that almost no one wants to admit to such extreme views. He's wobbled back and forth on a number of issues, but generally tried to strike a reasonable demeanor—in sharp contrast to Cuccinelli. But God doesn't like folks who run hot and cold, which is why McDonnell's a target, too.

Finally, just to be a wee bit bipartisan about it, we need to include Virginia's Democratic Senator Mark Warner in our list—though with a bit of twist. On the day of the earthquake, Warner was scheduled to speak at the Library of Congress Packard Campus for Audio Visual Conservation in Culpepper, Virginia. He arrived about 10 minutes after the quake, according to the local Star Exponent, which reported:
    The building had been emptied of its staff and the approximate 75 people who came to hear Warner so the former governor talked from under a tree atop Mount Pony. 
    “I was not going to mention the fact that one of the last times I was in Culpeper there was a tornado,” he said of an appearance years ago at CulpeperFest marked by wild weather. “If you don’t want me to come back, there’s an easier way to do this. If we start seeing frogs, it may be a sign of things to come,” he said. 
So it's not that God is angry with Warner, exactly. He just targets Warner for amusement, to see what he'll say next. And, of course, because he, too, represents Virginia, truly a state of sin.

8. North Carolina. 
Hurricane Irene could have barreled directly into South Carolina, but it delivered a stiff upper-cut to North Carolina instead. And why not? Governor Bev Perdue tried her darnedest to protect the state. She vetoed its draconian budget bill, only to see her veto over-ridden. It too was an attack on the poor -- the bill didn't just fail to balance spending cuts with tax increases, it actually let a temporary one-cent sales tax expire, along with some income taxes on high earners, while cutting $124 million in local education funding on top of $305 million cut in previous years. Perdue also vetoed a highly restrictive abortion law—one that, among other things, has a 24-hour waiting period, and force-feeds anti-abortion propaganda to women seeking an abortion—call it the “Bearing False Witness By Doctors Act.” But that veto was over-ridden as well—by a single vote in the state senate. So, really, God's hand was forced on this one. He had no choice but to strike North Carolina, and strike it hard.

Finally, there are two individual targets to consider:

9. Rick Perry.
While the one-two punch of the Virginia earthquake and Hurricane Irene were far removed from Texas Governor Rick Perry's stomping grounds, God had not forgotten Perry, but was merely preparing to toy with him. Perry, after all, had responded to a terrible drought in Texas not by implementing any long-term policy measures (which might make Texas better able to deal with the prospects of more severe droughts to come as global warming impacts increase), but by calling on Texans to pray.

Back in April, Perry proclaimed the "three-day period from Friday, April 22, 2011, to Sunday, April 24, 2011, as Days of Prayer for Rain in the State of Texas.” Since then, however, things have only gotten worse, as Timothy Egan noted in the NY Times “Opinionator” blog, "[A] rainless spring was followed by a rainless summer. July was the hottest month in recorded Texas history....Nearly all of Texas  is now in 'extreme or exceptional' drought, as classified by federal meteorologists, the worst in Texas history. Lakes have disappeared. Creeks are phantoms, the caked bottoms littered with rotting, dead fish.”

Somehow, though, it seemed like most folks outside of Texas had no idea of Perry's failed prayer initiative. That's where God came in, following up Irene with the tantalizing prospect of a Gulf of Mexico storm that would finally bring relief to the Longhorn state. But alas no. First Tropical Storm Jose petered out entirely, then Tropical Storm Lee turned to Louisiana instead. If you pray with Perry, you obviously take the Lord's name in vain. As one frustrated Texan wrote on Reddit, “Perry's prayer has been answered. The answer was 'No'.” God is making things perfectly clear, as Richard Nixon would say: If you want someone praying for America in the White House, Rick Perry is not your guy.

10 God.
Yes, it's true, God Himself was one of the main targets of God's wrath, particularly during the earthquake, which did remarkably little damage to the living. But, as Rob Kerby noted at BeliefNet, churches took some pretty hard hits:
    “Churches seemed to bear the brunt of Tuesday’s 5.8 earthquake on the East Coast.
    “Significant damage was reported to Washington, D.C.’s National Cathedral and St. Peter’s Catholic Church, historic St. Patrick’s Church near Baltimore, and two churches in Culpepper, Va., close to the epicenter — St. Stephen Episcopal Church and Culpepper Christian Assembly.” 
Okay, so maybe God's not self-flagellating. Maybe it's the tenants who are being targeted. But who's to say, really? And if the God's wrath biz is all about appropriating authority to cast blame around, then why not think really big, and proclaim God Himself to be the target? Pat Robertson & company have monopolized this gig for far too long. If the rest of us are to have any hope of catching up, we're got to make ourselves a splash. And what better way to make a splash than proclaiming that God is the target?

Obama Millionaire's Tax: President To Seek New Tax Rate For Wealthy

 (I criticize Obama daily it seems, but I will give him props on this as long as he doesn't back off it and capitulate to the Corporatist Democrats and Republicans, Wall Street, corporate executives and billionaires like the Koch Bros.--jef)


By JIM KUHNHENN, Associated Press
Huffington Post - 9/17/11

WASHINGTON -- President Barack Obama is expected to seek a new base tax rate for the wealthy to ensure that millionaires pay at least at the same percentage as middle income taxpayers.

A White House official said the proposal would be included in the president's proposal for long term deficit reduction that he will announce Monday. The official spoke anonymously because the plan has not been officially announced.

Obama is going to call it the "Buffett Rule" for Warren Buffett, the billionaire investor who has complained that rich people like him pay a smaller share of their income in federal taxes than middle-class taxpayers.

Buffett wrote in a New York Times op-ed piece last month that he and his rich friends "have been coddled long enough by a billionaire-friendly Congress."

The measure would be in addition to $447 billion in new tax revenue that Obama is seeking to pay for his short-term spending and tax cutting plan to jump start the economy.

House Speaker John Boehner said Thursday he would oppose tax increases to reduce the deficit. Boehner has urged Congress' deficit "supercommittee" to lay the groundwork for a broad overhaul of the U.S. tax code.

The panel has almost unlimited authority to recommend changes in federal spending and taxes and is working against a deadline of Nov. 23.

Boehner said the panel has "only one option, spending cuts and entitlement reforms," a reference to government benefit programs such as Social Security, Medicare and Medicaid.

Any broad compromise that clears the bipartisan committee is almost certain to require Democratic agreement to savings from programs such as Social Security and Medicare, along with Republican acquiescence to additional revenues, although any such trade-offs are rarely discussed openly until the last possible moment in negotiations.

Obama's new tax proposal was first reported by The New York Times.

Progressives Unveil Their Plan To Save The Middle Class


The Congressional Progressive Caucus has unveiled their framework for jobs, which augments and expands upon the President's American Jobs Act. 


The CPC's Rebuild The American Dream Framework has six parts to it. Specific policy proposals will be forthcoming, but here is the high level overview:
  • Make it in America Again - focus on bolstering U.S. manufacturing
  • Rebuild America - focus on infrastructure as a larger part of the jobs policy than the White House proposal
  • Lead the Green Industrial Revolution - blending the first two elements into a focus on green industries and products
  • Jobs for the Next Generation - Job training and education for young people
  • Not Just Jobs – Good Jobs - Reinforcing Americans' right and access to collective bargaining, promoting jobs that provide wages, benefits and security that will preserve the middle class
  • Fair Taxes – Shared Sacrifice - Pay for the program by taxing the wealthy in this country
At a time when poverty in this country has risen to one in six Americans, where joblessness among young people is at its highest level since the Great Depression, and jobs are the single biggest issue on the table, this framework is most welcome. It's the product of discussions caucus members had during the summer as they toured the country and spoke to people about what most concerned them.

While there are no specifics yet, there are some cues to be taken from progressives' budget proposal released earlier this year, which proposed a 45 percent tax rate on the wealthiest earners in this country, ending the wars, and preserving the social safety net for generations to come.

It's important to recognize that progressives are not trying to compete with the American Jobs Act, but instead have offered proposals which dovetail and augment his. I interpret that message as one of support not just for his plan, but for a larger vision of what can be done with the support of the American people.

David Gergen says Many were 'Horrified' By Republican Debate

Six Big Lies About The Economy


From The Uptake -- Reich Debunks Six Big Lies About The Economy:
Is Social Security a Ponzi scheme as Republican Presidential candidate Rick Perry claims? Noted author and former US Labor Secretary Robert Reich debunks that claim and five other lies the right-wing tells about taxes, government and the economy. The lies Reich debunks:
  1. Tax cuts to the rich and corporations trickle down to the rest of us. (No it doesn't and it never has.)
  2. If you shrink government you create jobs. (No, you get rid of jobs that way.)
  3. High taxes on the rich hurts the economy. (No, the economy grew when the US did this under Eisenhower.)
  4. Debt is to be avoided and it is mostly caused by Medicare. (No, if debt is properly used to grow the economy, it becomes a smaller part of the budget because of increased revenue and Medicare has the lowest overhead of any health insurance plan out there.)
  5. Social Security is a Ponzi scheme (No, its solid for 26 years. Rick Perry is "lying through his teeth" says Reich. Social Security is solid beyond that if the rich pay the same percentage in social security taxes as the rest of us do.)
  6. We need to tax the poor. (This is what Republicans have been proposing when they say any tax reform needs to involve all Americans because poor people pay no income tax. The poor have no money and taxing them will not solve our budget problems.)

US is a two party dictatorship says Ralph Nader

Posted on 09.15.11
By Eric W. Dolan


Ralph Nader appeared Thursday on Fox News to discuss a democratic primary he was organizing against President Barack Obama to “hold his feet to the fire.”

“The important thing here is if he’s not challenged from the progressive-liberal wing of his party, that elected him, it’ll be a very dull campaign, people will not be very enthusiastic, more and more people will stay home, it’s not good for him,” Nader said. “If he’s a good debater, if he knows his facts, he’ll want to be challenged because he’ll come out much sharper.”

When asked about the possibility of a third party candidate succeeding in the 2012 presidential election, Nader said it would be a hurdle for anyone who wasn’t a billionaire.

“It’s a two party dictatorship unless you’re worth billions of dollars.”

Watch video, via MoxNews.com, below:


Inside the Surveillance State: How Peaceful Activists Get Swept Up onto "Terrorist" Watch Lists

There appears to be no end to the appetite for data to be stored and mined, and all sorts of agencies want a share of the action.
By Nancy Murray and Kade Crockford, TruthOut and ACLU Massachusetts
Posted on September 15, 2011

 Ten Years Later: Surveillance in the "Homeland" is a collaborative project with Truthout and ACLU Massachusetts.

How little - yet how much - has changed in the last 40 years. The COINTELPRO papers sound distinctly 21st century as they detail the monitoring of perceived threats to "national security" by the FBI, CIA, National Security Agency (NSA), Secret Service, and the military, as well as the intelligence bureaucracy's war on First Amendment protest activity.
 
The Church Committee investigation concluded in 1976 that the "unexpressed major premise of the programs was that a law enforcement agency has the duty to do whatever is necessary to combat perceived threats to the existing social and political order."

In addition to massive surveillance, assassinations and dirty tricks "by any means necessary" included the creation of NSA "watch lists" of Americans ranging "from members of radical political groups, to celebrities, to ordinary citizens involved in protests against their government," with names submitted by the FBI, Secret Service, military, CIA, and Defense Intelligence Agency. The secret lists, which included people whose activities "may result in civil disturbances or otherwise subvert the national security of the US," were used by the NSA to extract information of "intelligence value" from its stream of intercepted communications.


We learned that there was, apparently, no easy way to get off the FBI's "security index."  Even after the criteria for fitting the profile of a "subversive" were revised in the mid-1950's, the names of people who no longer fit the definition remained on IBM punchcards, and were retained in field offices as "potential threats." A card would only be destroyed "if the subject agreed to become an FBI source or informant" or in another way indicated a "complete defection from subversive groups."

By 1960, the FBI had compiled 432,000 files on "subversive" individuals and groups, and they were getting hard to handle. The following decade brought the promise of a technological fix. Under the guidance of the attorney general at the time, Ramsey Clark, the FBI explored the potential for "computerizing the master index." The goal of Clark's Interdivision Information Unit was to harness "automatic data processing" to put information about people collected from external and internal sources in a "quickly retrievable form."

Forty years later, the same "by any means necessary" mindset is harnessed to a national surveillance industrial complex that pumps out some 50,000 intelligence reports every day into the FBI's Terrorist Screening Database (which contains over a million names, including aliases). This error-ridden "master list" is not to be confused with the National Counterterrorism Center's Terrorist Identities Datamart Environment (TIDE) system, which held 640,000 identities in March 2011. There arereported to be about a dozen terrorism watch lists or databases, and a single tip from a credible source is all it takes to get into one or more of them, while there is no reliable way to get out.

Given the legion of local, state and federal agents seeking out harbingers of "terrorist activity," the fact that espousing "radical" beliefs is grist for a Suspicious Activity Report (SAR) and the virtually unchecked ability of FBI operatives to spy on groups without suspicion of wrongdoing, it is not surprising that the same kind of groups that were infiltrated and spied on by the FBI, NSA, CIA, and Department of Defense (DoD) under COINTELPRO are featuring in Joint Terrorism Task Force (JTTF) investigations and fusion center data banks. The secrecy shrouding "national security" matters and the blurred jurisdictions that turn FOIA requests into pieces in a "pass the buck" shell game have made it impossible to get a clear picture of the extent of spying on protected First Amendment activity. But leaks and oversight reports indicate that a 21st century Church Committee would find a mention of any group that challenges the status quo somewhere in the vast domestic surveillance labyrinth.

In his 2010 report, "A Review of the FBI's Investigation of Certain Domestic Advocacy Groups," Glenn Fine, the (now retired - and not replaced) inspector general of the Justice Department, concludes that the FBI had "little or no basis" for investigating many advocacy groups and individuals, and that it made false and misleading statements to the public and Congress to justify its surveillance of an antiwar rally organized by a peace and social justice organization, the Thomas Merton Center of Pennsylvania. Not only did it routinely classify actions involving nonviolent civil disobedience as "Acts of Terrorism matters," it also, "relied upon potential crimes that may not commonly be considered 'terrorism' (such as trespassing or vandalism)" to get people placed on watch lists and their travels and interactions tracked.

Around the country, databases have swelled with information about antiwar and other protests that are classified as "potential terrorist activity." Intelligence oversight reports indicate that the Pentagon, which defined protest in training materials as "low-level terrorism activity," monitored and shared intelligence on groups ranging from Alaskans for Peace and Justice to Planned Parenthood, and used Army signals intelligence in Louisiana to intercept civilian cell phone conversations. It was revealed late in 2005 that the DoD had a secret database called Theart and Local Observation Notice (TALON) maintained by its Counterintelligence Field Activity (CIFA) unit. Among its 13,000 reports were dozens detailing antiwar activity, along with photos of protesters. Meetings were sometimes infiltrated and information widely shared among partner agencies. Events classified as "threats" included the gathering of activists at a Quaker meeting house in Lakewood, Florida, to plan a protest of military recruiting at the local high school, a Boston protest outside a military recruiting center and a peace march through the streets of Akron, Ohio, tailed by local police who had been tipped off by the Pentagon.

Although CIFA was disbanded after the extent of its spying was revealed, the TALON database has been preserved and is expected to be part of a new repository of information housed at the Pentagon's Defense Counterintelligence and Human Intelligence Center. A notice in the Federal Register for June 15, 2010, states that the new repository will have a broad domestic and homeland security mandate and will amass personal data, citizenship documentation, biometric data and "reports of investigation, collection, statements of individuals, affidavits, correspondence, and other documentation pertaining to investigative or analytical efforts by the DoD and other US agencies to identify or counter foreign intelligence and terrorist threats."

The Posse Comitatus Act's substantial limitations on the use of the military in domestic law enforcement appear to have all but vanished. Indeed, in Washington State, John Towery  - a member of Force Protection Service at Fort Lewis who infiltrated and spied on peace groups in Olympia and shared information with the Army, JTTF, the FBI, local police departments and the state fusion center - is being sued by groups claiming his undercover surveillance violated the Act. A document leaked by WikiLeaks outlines how a "fusion cell" in a military police garrison integrated with local, county, regional, state and federal law enforcement can avoid the usual constraints on military intelligence by operating "under the auspice and oversight of the police discipline and standards." In the words of former Olympia City Council member T.J. Johnson, who was one of the people spied on by Towery, "The militarization of domestic law enforcement is one of the more disturbing trends in recent years."

Leaks from fusion centers reveal that peace groups share a place on surveillance databases with environmental groups, animal rights groups, student groups, anti-death penalty organizations, Muslim organizations, conspiracy theorists, Ron Paul supporters, the American Civil Liberties Union (ACLU), the Nation of Islam and "Black Extremists." The Virginia Fusion Center cited various historically black colleges and universities as potential "radicalization nodes" for terrorists. The Maryland State Police, which works with the FBI as part of a JTTF and shares information with the state's fusion center, infiltrated protest activity, kept error-ridden "terrorist" files on activists and was notified by the Department of Homeland Security (DHS) about what groups should be monitored. Bette Hoover, a retired nurse who is a grandmother and Quaker antiwar activist, was surprised when documents came to light listing her as a member of People for the Ethical Treatment of Animals (PETA) and direct action group The Ruckus Society - organizations she never belonged to - and placing her at demonstrations she had never attended. She now understands why she receives special scrutiny at airports.

Given the enormous dimensions of the secretive echo chamber in which flawed information is disseminated, it is difficult to see how the record can ever be set straight. Once a person is in a database, there seems to be no more inclination to delete all traces of that individual (assuming this is even possible) than to remove an IBM punch card from J. Edgar Hoover's security index. The FBI today wants to keep all Suspicious Activity Reports in its eGuardian database, on the grounds that even if there is no connection to terrorism or crime today, one may become clear tomorrow as it continues to add information to a person's profile and mine information about their associations.

In the age of the Total Information Awareness program, there appears to be no end to the appetite for data to be stored and mined, and all sorts of agencies want a share of the action. There was little attempt to rein in the NSA after whistleblowers Russell Tice and Thomas Tamm revealed an "overcollection" of data of staggering proportions through the Agency's access to the phone calls, text messages, faxes and emails affecting the communications of "all Americans" - including Bill Clinton.  Data captured through the NSA's warrantless surveillance program has reportedly been systematically archived for data mining purposes.

The US Joint Special Operations Command is meanwhile establishing a mega fusion center at a secret address near the Pentagon which will serve as "the offense end of counterterrorism, tracking and targeting terrorist threats that have surfaced in recent years" and advising domestic law enforcement "in dealing with suspected terrorists inside the US." It will feature a cloud-computing network combining "all elements of US national security, from the eavesdropping capabilities of the National Security Agency to Homeland Security's border-monitoring databases."

Not to be outdone, the FBI has erected a giant Investigative Data Warehouse (IDW) containing 1.5 billion records and counting - much of it classified - including information collected through nearly 300,000 National Security Letters, criminal records, financial records, intelligence reports, gang information, terrorist information, open source data and more. According to the Electronic Frontier Foundation, whoseFreedom of Information Act (FOIA) litigation has brought the data trove to light - the "future of the IDW is data mining" as the FBI uses "link analysis" and "pattern analysis" in the hunt for "pre-crime."

The neverending hunger for data may be one reason why the FBI, in late 2010, raided the homes and seized computers, cell phones and files belonging to peace and justice activists in Illinois, Minnesota and Michigan. Twenty-three of them have been issued with grand jury subpoenas, some for allegedly giving "material support" to a foreign terrorist organization by meeting with groups in Colombia and Palestine. 

"We're conflating proper dissent and terrorism," warned former FBI agent and whistleblower Coleen Rowley:
A secretive, unaccountable, post 9/11 homeland security apparatus has increasingly turned inward on American citizens. The evidence includes everything from controversial airport body scanners to the FBI's raids last September on antiwar activists' homes ... Agents are now given a green light, for instance, to check off "statistical achievements" by sending well-paid manipulative informants into mosques and peace groups. Forgotten are worries about targeting and entrapping people not predisposed to violence.... The massive and largely irrelevant data collection now occurring only adds hay to the haystack, making it even harder to see patterns and anticipate events. "Top Secret America" needs to ask itself who is more guilty of furnishing "material aid to terrorism: - its own operatives, or the activists and protesters it so wrongheadedly targets.

A Lost Decade for Working Families in the US

Poverty and income trends continue to paint a bleak picture for working families


The 2010 poverty and income data released yesterday morning by the U.S. Census Bureau are yet another reminder of the continued weight of the Great Recession on families in the United States. The Great Recession officially ended in the summer of 2009, but the labor market continued deteriorating through the end of 2009, and the modest economic growth in 2010 was not enough to compensate for those losses.  From 2009 to 2010, the number of jobs fell by 658,000, the unemployment rate increased from 9.3 percent to 9.6 percent, and the share of unemployed workers who had been unemployed for more than six months climbed from 31.2 percent to 43.3 percent. Thanks to this deterioration in the labor market, incomes dropped and poverty rose.

AUDIO: Listen to EPI’s press call about the 2010 report

Key findings from the Census Bureau’s report


Poverty
  • The poverty rate increased from 14.3 percent in 2009 to 15.1 percent in 2010, representing an additional 2.6 million people living in poverty and bringing the total number of people in poverty in the United States to 46.2 million.
  • The poverty rate for children was 22.0 percent in 2010, representing 16.4 million kids living in poverty. In 2010, more than one-third (35.5 percent) of all people living in poverty were children.
  • The poverty rate for working-age people (18- to 64- year-olds) hit 13.7 percent in 2010, the highest rate since the series began in 1966. Poverty among the elderly (age 65 and older) poverty was statistically unchanged over the year.
  • The poor are getting even poorer. In 2010, the share of the population below half of the poverty line hit a record high of 6.7 percent.
  • Nearly one in 10 children (9.9 percent) fell below half of the poverty line in 2010, up from 9.3 percent in 2009.
  • Non-Hispanic whites maintained far lower poverty rates than any other racial/ethnic group. Blacks were particularly hard-hit by increases in poverty from 2009 to 2010, increasing 1.6 percentage points to reach a rate of 27.4 percent.
  • In 2010, over one-third of black children (39.1 percent) and Hispanic children (35.0 percent) were living in poverty. The poverty rate for families with children headed by single mothers hit 40.7 percent in 2010. Of the 7.0 million families living in poverty in 2010, 4.1 million of them were headed by a single mom.
Income
  • Between 2000 and 2010, median income for working-age households fell from $61,574 to $55,276, a decline of roughly $6,300, which is more than 10 percent.
  • Disparities in incomes among racial and ethnic subgroups grew in 2010, as racial and ethnic minorities experienced particularly large declines in income. The  black household earning the median income is now bringing in $5,494 less than the median black household did 10 years ago (a drop of 14.6 percent) and the median Hispanic household is now bringing in $4,235 less than the median Hispanic household did 10 years ago (a drop of 10.1 percent).
  • There were losses across the income distribution in 2010, particularly at the very bottom and the very top. In 2010, incomes of families in the middle fifth of the income distribution fell 0.9 percent, for a total decline of 6.6 percent since 2007. Families at the low end of the scale were hit harder, with the bottom fifth losing 3.5 percent in 2010 and 11.3 percent from 2007 to 2010. The top fifth lost 2.7 percent in 2010, but since their losses in the prior two years were modest, the total decline from 2007 to 2010 was a relatively modest 4.5 percent.  
  • The median, or typical,  inflation-adjusted earnings of men working full-time year-round fell slightly from $47,905 in 2009 to $47,715 in 2010, while the median earnings of full-time year-round female workers stayed essentially flat, at $36,877 in 2009 and $36,931 in 2010.
A quick comment on the effect of ARRA
How did the American Recovery and Reinvestment Act of 2009 (ARRA) affect the 2010 poverty and income numbers? Because ARRA was passed in February and was in the process of ramping up through the end of 2009, its full impact was felt in 2010.  ARRA primarily affected these numbers by creating and saving jobs, the earnings from which otherwise would not have been there supporting family incomes. The Congressional Budget Office estimates that the Recovery Act created or saved around one million full-time equivalent jobs in 2009, and 3.4 million jobs in 2010. Without these jobs, the decline in income and increase in poverty would have been much more dramatic. In other words, the new Census Bureau report is ugly, but without ARRA, it would have been much uglier. This underscores the growing impact of the end of ARRA—in the current quarter, ARRA is supporting only 2.3 million full-time equivalent jobs, and the number of jobs supported drops to half a million by the fourth quarter of 2012. This means that the loss of the boost from government action is—and without additional intervention will continue to be—a substantial drag on jobs and family income.

What about the direct income supports in ARRA? Of three major income supports in the stimulus—unemployment insurance, nutritional assistance (food stamps), and tax cuts—only unemployment insurance is counted in the income numbers just released; the income numbers include cash income received from programs such as unemployment insurance, but exclude noncash benefits like food stamps, and are measured before payments of taxes, so they do not reflect reductions in taxes. While unemployment insurance benefits replace a maximum of half of a worker’s prior earnings, these benefits went to workers who were laid off and who had low odds of quickly finding another job (in 2010, there were 5.3 unemployed workers per job opening on average). In other words, these unemployment benefits went to families that otherwise would likely have suffered even steeper income declines, and in some cases dropped below the poverty line. Census data show that 3.2 million people were kept out of poverty in 2010 by unemployment insurance benefits alone.


Poverty:  Record highs
Between 2009 and 2010, an additional ­­­­­­2.6 million people slipped below the poverty line, as the poverty rate increased from 14.3 percent to 15.1 percent. The rate represents 46.2 million people living in poverty in the United States. The last time the poverty rate was higher was in 1983, when it was 15.2 percent (as shown in Figure A).


The poverty rate for children in 2010 was 22.0 percent, higher than the overall rate and up more (1.3 percentage-points) than the overall poverty rate, which increased 0.8 percentage points from 2009 to 2010. The 2010 “children’s poverty rate” represents 16.4 million kids living in poverty. In 2010, more than a third—35.5 percent— of all people living in poverty were children.

Nearly all of the decline in poverty achieved during the business cycle of the 1990s has now been reversed. From 1989 to 2000, overall poverty declined by 1.5 percentage points, and child poverty dropped by 3.4 percentage points. From 2000 to 2010, however, poverty increased overall by 3.8 percentage points, and by 5.8 percentage points among children. The large increase in poverty suggests that as anti-poverty policies have come to depend more on paid work as the main pathway out of poverty, the safety net has become less effective in reducing economic hardship when the economy and job market are underperforming.


The poverty rate for working-age people, those 18-64 years old, increased by 0.7 percentage points, from 12.9 percent in 2009 to 13.7 percent 2010,  the highest rate since the series began in 1966 (Figure B). Over the same five decades, the poverty rate for persons older than 65 dropped precipitously, due in part to Social Security payments, which have effectively lifted millions of elderly Americans out of poverty. In 2010, the elderly poverty rate, 9.0 percent, was statistically unchanged from 2009.


Figure C displays the share of the population falling below half of the poverty line from 1975–2010. In 2010, 50 percent of the poverty line for a two-adult two-child family was $11,057. This measure tracks the depth of poverty, those living on half the subsistence rate. In 2010, 6.7 percent of people were living below half of the poverty line, up 0.4 percentage points since 2009—a record high share of the population in deep poverty since the Census Bureau began tracking this statistic in 1975. Not shown in the figure but alarming: Nearly one in 10 children (9.9 percent) were below half the poverty line in 2010, up from 9.3 percent in 2009.


As shown in Figure D, poverty rates and changes in those rates have varied across racial and ethnic groups. Non-Hispanic whites experienced the lowest rate of poverty at 9.9 percent, while the rates for blacks and Hispanics were more than two-and-a-half times higher at 27.4 percent and 26.6 percent, respectively. Poverty rates also increased more between 2009 and 2010 for blacks and Hispanics than for other groups.


The 2000s have all but erased any gains to reducing poverty in the 1990s. This recession has only exacerbated the damaging trends over the last decade, leaving some of the most vulnerable populations with large shares living below the poverty line. Figure E shows changes over time in poverty rates for particularly vulnerable populationschildren, racial and ethnic minority children, and single-mother families. From 2000 to 2010, black children experienced a 7.9 percentage-point increase in poverty, reaching 39.1 percent. Hispanic children experienced an increase of 6.6 percentage points over the same period, reaching 35.0 percent.

For families headed by single mothers, there was a 7.7 percentage point jump from 2000 to 2010 to 40.7 percent. In 2010, 4.1 million of the 7.0 million families living in poverty were headed by single moms.


Income:  Another lost year in a lost decade
From 2009 to 2010, median household income, adjusted for inflation, fell from $50,599 to $49,445, a decline of $1,154, or 2.3 percent. Working-age households—those with a head of household younger than 65 years old—experienced even larger declines because they are most exposed to the labor market and therefore most likely to be affected when the labor market deteriorates. The median income of working-age households fell from $56,742 in 2009 to $55,276 in 2010, a decline of $1,466, or 2.6 percent.


Figure F shows real median income over the last three decades for all households and, starting in 1994 when the data became available, for working-age households. A key point here is the comparison between business cycles. From 1979 to 1989, real median income grew $3,002 (from $46,074 to $49,076); from 1989-2000, it grew $4,088, (from $49,076 to $53,164). But for the first time on record, over the business cycle from 2000-07, incomes did not rise, but fell slightly, from $53,164 to $52,823. And with the weak labor market over this period, the real median income of working-age households fell significantly, from $61,574 to $59,460. This means that working families are weathering the current economic downturn on the heels of one of the worst economic expansions on record.

These figures show that 2010 was but another year of income declines in a decade of declines: From 2000 to 2010, median income for working-age households fell from $61,574 to $55,276, a decline of roughly $6,300, which is more than 10 percent.


Disparities in incomes among racial and ethnic subgroups grew in 2010, as racial and ethnic minorities experienced particularly large income declines, with African Americans getting hit the hardest. Figure G shows real median household income for racial and ethnic subgroups over the last two decades. The median income of non-Hispanic whites declined by 1.3 percent in 2010 and has declined by 5.4 percent since the start of the recession in 2007 . (In dollar terms, it fell from $57,752 to $54,620 over this period). The median African American household experienced a decline of 3.2 percent in 2010 and a total decline of 10.1 percent since 2007 (falling from $35,665 to $32,068). The median Hispanic household experienced a decline of 2.3 percent in 2010 and a total decline of 7.2 percent since 2007 (falling from $40,673 to $37,759).

The Great Recession and its aftermath have wiped out all improvements in median black income since 1996, all improvements in median Hispanic income since 1998, and all improvements in median white income since 1997. The median black household is now bringing in $5,494 less than it did 10 years ago (a drop of  14.6 percent) and the median Hispanic household is now bringing in $4,235 less than it did 10 years ago (a drop of 10.1 percent).


There were losses across the income distribution in 2010, particularly at the very bottom and the very top (see Figure H). In 2010, incomes of families in the middle fifth of the income distribution fell 0.9 percent, for a total decline of 6.6 percent since 2007.  Families at the low end of the scale were hit harder, with the bottom fifth losing 3.5 percent in 2010 and 11.3 percent from 2007 to 2010.  The top fifth lost 2.7 percent in 2010, but since their losses in the prior two years were modest, the net change from 2007 to 2010 was a relatively modest 4.5 percent. The rise in inequality over the last three years compounds thirty years of increasing inequality. Furthermore, with unemployment expected to remain high for years to come, inequality is likely to increase because weak labor markets have a larger negative impact on income at the middle and low end of the income distribution.

Particularly astonishing over the last three years has been the drop in the number of earners working full-time (35 hours or more per week) and full-year (at least 50 weeks, including paid time off).  Between 2007 and 2010, there was a 9.4 million decline in the number of people with full-time, full-year employment and a 3.9 million increase in the number of people with part-time and/or part-year jobs.


 As Table 1 shows, a disproportionate share of the erosion in full-time, full-year work over this period was among men—the number of men working full-time, full-year dropped by about 6.6 million between 2007 and 2010, while there was a 2.8 million drop in the number of women working full-time, full-year.  However, focusing just on the change from 2009 to 2010, the gender dynamics were reversed, with a 754,000 decline in total employment among men and an 854,000 decline among women. Furthermore, losses were larger among part-time and/or part-year workers in 2010 than among full-time full-year workers, both male and female. Although it is not depicted in the table, the number of “involuntarily part-time workers”—workers who work part-time but want a full-time job (from the Census Bureau’s Current Population Survey)—was virtually unchanged from 2009 to 2010, after increasing  by 4.5 million between 2007 and 2009.


In 2010, the median male working full-time, full-year experienced a slight drop in real earnings  of 0.4 percent, from $47,905 to $47,715, while the median female working full-time, full-year experienced very little change, with an increase of 0.1 percent, from $36,877 to $36,931 (see Figure I). The persistent high unemployment dampens earnings growth even for those who have full-time, year-round employment. Looking from 2007 to 2010, the shift from full-time, full-year employment to part-time and/or part-year employment contributed to the overall drop in median earnings: The annual inflation-adjusted earnings for the median male worker dropped from $38,524 to $36,676 between 2007 and 2010, and for the female median worker from $27,212 to $26,552.

Conclusion
The new data on income and poverty underscore the real, human consequences of the economic downturn. The labor market is the core building block of family incomes—when the labor market falters and people lose work, hours, and wages, family incomes drop and poverty rises. The Census Bureau’s report shows that much of the income and anti-poverty gains made in the 1990s have been more than erased due to both the weak business cycle from 2000-07 and the lasting effects of the Great Recession. While the Recovery Act stemmed the losses from the Great Recession, it was never big enough to right the economic ship given the scale of the crisis. With unemployment expected to stay above 8 percent well into 2014, it is time for Congress to once again act boldly to create jobs so that America’s residents have the work they need to provide for their families. The jobs plan that President Obama announced last week takes an important step in the direction of a solution that matches the scale of the ongoing crisis. For more on what we can and should be pursuing to generate jobs, see EPI’s Putting America Back to Work.

+++++
JOLTS
If one takes the official broader definition of unemployment, or U6, in July at 16.1%, the ratio becomes even worse, 7.78* unemployed people per each job opening for July. Below is the graph of number of unemployed, using the broader U6 unemployment definition, per job opening.

u6 jolts july 2011

If you do not like the use of U6 to look at the real number of people looking for a job to actual opportunities, consider this number. In July 2011, of those not in the labor force, 6,575,000 were actually wanting a job. U-6 only includes 2,785,000 of this number.
The rates below mean the number of openings, hires, fires percentage of the total employment. Openings are added to the total employment for it's ratio.
  • openings rate - 2.4%
  • hires rate - 3.0%
  • separations rate - 3.0%
Below are raw job openings, way below pre-recession levels.

job openings

Believe this or not, one month past the so called end of the Great Recession, July 2009, job openings have only increased by 1,116,000. July 2009 was the low point of job openings, 2,112,000. That's pathetic. In March 2007, a few months before the start of the recession (December, 2007), the number of job openings was 4,755,000.

We can see some of labor market malaise in the actual hires from July, 3,984,000, which declined by -74,000, or -1.82% from June.

hires

Below are total job separations, 3,920,000, which is a monthly decrease of -73,000 or -1.83%. The term separation means you're out of a job through a firing, layoff, quitting or retirement, so a decrease is good. Yet, notice how separations is almost equal to the number of hires, 3,984,000. Take this as a symptom of the disposable worker syndrome.

jolts separations

The number of quits or voluntary job separations are still dangerously close to the number of fires, although improved from November 2010, as well as June 2011. Want a choice of employers? Doesn't seem to be much of an option today. Quits were 50% of the total separations whereas layoffs and fires were 43% in July. In June, quits were 48%, whereas layoffs and fires were 44%, so a slight, but certainly not enough, improvement.

Below are quits minus discharges and layoffs. When quits comes close to firings that means people have little choice in employment. You want to see choice, or quits, rise and be much higher than firings. The below graph shows people still do not have many options when it comes to a job.


The JOLTS takes a random sampling of 16,000 businesses and derives their numbers from that. The survey also uses the CES, or current employment statistics, not the household survey as their base benchmark, although ratios are coming from the household survey, which gives the tally of unemployed.

The BLS was kind enough to make a credible Beveridge Curve graph, reprinted below. The Beveridge curve shows the official unemployment rate vs. the job openings rate, over time. If you see a bunch of data points to the far right, that's bad, it means there is long term unemployment and not enough jobs. Look at how we're stuck to the right. July 2011 moved slightly left of June 2011. The green, representing the 2009 time period, shows how fast we went to the right and the purple, which is 2010, 2011, means we are stuck there.

This graph shows working America is in big trouble and considering how the August unemployment report is much worse, don't expect things to get better. Remember, this report is for July, not August.

beveridge 7/11


For the JOLTS report, the BLS creates some fairly useful graphs, some of which were reprinted here, and they have oodles of additional information in their databases, broken down by occupational area. The Saint Louis Federal Reserve also had loads of graphing tools for JOLTS. Below is a reprint of the BLS bubble graph, and the first thing to note is how health and educational employment dwarfs manufacturing. For economies of scale, we really need to see that manufacturing bubble grow and grow, it's about 11% of the total economy which is not good for a host of reasons. You can also see how the housing bubble deflation has laid to waste construction jobs.

joltsbubble occupational job openings 7/11

Also, bear in mind professional and technical services is notorious to import workers on foreign guest worker Visas, displacing Americans. Employers also quite often put out fictional job openings, demanding perfect skill matches to the point no one on the globe has that experience.

*U6 
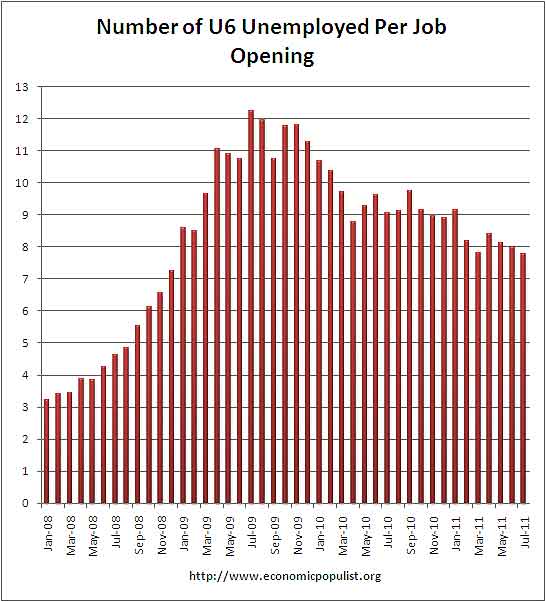
is defined as the official unemployed plus people who are in part-time jobs for economic reasons plus the marginally attached. The marginally attached,M, are officially not part of the civilian labor force, CLF, and also not seasonally adjusted. The above graph was created by the seasonally adjusted levels of the unemployed, part-time for economic reasons and the marginally attached. The raw U-6 totals can also be calculated by this formula:

\frac{(CLF + M) * U6} O
where
O=\text {Job Openings}

Why the Unemployment Crisis Is Even Worse Than You Think

Here are 11 unemployment facts that mass media underreport or ignore completely. 
By Michael Thornton, AlterNet
Posted on September 14, 2011

President Obama recently addressed the nation during a joint session of Congress and the main theme of that address was the need to create jobs, lots of jobs, millions of jobs. The Great Recession has cost US workers millions of jobs and those jobs have not come back as quickly as they disappeared and in many cases those jobs will never return. According to the Economic Policy Institute, “In total, there are 6.9 million fewer jobs today than there were in December 2007.”

That is only a small part of the jobs-hole story, a story that is often ignored, overlooked and oversimplified by mass media.

The media has failed to present the unemployment problem, with all its associated economically devastating consequences, in the manner it deserves. It’s possible that unemployment facts and figures don’t translate well for advertisers, or they are too cumbersome to present in a two-minute segment. Whatever the reason, the mass media seem to avoid unemployment details as they would avoid describing and filming fresh road kill during a dinnertime newscast. While some excellent blogs clearly explain unemployment data, such as Mish’s Economic Trend AnalysisCalculated Risk and Economic Populist, mass media sites are absent.

The (U-3) unemployment rate remained at 9.1% (U-6 is 16.2%) for August. Unemployment to the mass media generally centers on that single point within the Bureau of Labor Statistics (BLS) monthly employment report. There is passing mention of discouraged workers and the underemployed, but the true scale of the jobs crisis is given scant attention considering the magnitude of the problem.

What follows are 11 unemployment details that mass media underreports or ignores completely. This list will not be recalled fondly as a top-10 list of best quarterbacks or favorite vacation retreats would, but it’s where the REAL unemployment crisis is exposed.
  1. The jobs deficit: That is the total number of jobs lost PLUS jobs that should have been created since the recession began in December 2007; as mentioned above, there are 6.9 million fewer jobs today than at the start of the Great Recession, but that tells only half the tale of the jobs deficit. There is also the matter of creating jobs to keep up with the increase in workforce population. Those new workers include high school and college graduates, and immigrants. The number of jobs that need to be created each month to accommodate new entrants into the workforce ranges from 120,000 - 150,000. Adding together the jobs lost since the recession and the new jobs needed for population growth, the total jobs deficit is estimated to be 11.3 million. A few tax breaks, some targeted workforce retraining and some regulatory relief for businesses are not going to be the forces behind the creation of more than 11 million jobs. A massive effort is required to fill that gaping jobs hole.
  1. Filling the jobs deficit: According to EPI: “To fill that gap in three years – by mid-2014—while still keeping up with the growth in the working-age population—would require adding around 400,000 jobs every single month. To fill the gap in five years—by mid-2016—would mean adding 280,000 jobs each month. By comparison, over the last three months, the economy added just 35,000 jobs, on average.”
    It’s striking that the economy has created only 105,000 jobs during the past three months. When considering only the new entrants to the workforce, such as recent college graduates, that three-month span produced a shortage of 270,000 or more jobs.  
  1. The Birth/Death Model: This is not births and deaths of people, but of businesses. The BLS estimates how many jobs were created or lost by business formations or closings.  In August, the BLS estimated that 87,000 jobs were created by new businesses.
    This is an often discussed employment barometer at many economy centered blogs, but mass media pays it meager attention. Why is that so? It’s a complicated model that can make the head spin of even the most astute employment expert. But there appears to be agreement that the model has a tendency to misread the economic cycle, as Calculated Risk points out, “A few years ago several people -- myself included -- pointed out that the birth/death model would miss turning points in employment. I thought the model would overstate the number of jobs added as the economy slid into recession (and understate the number of jobs lost monthly during a recession). Sure enough that is what the annual benchmark revision showed during the employment recession.”  
    To illustrate just how wide this model can be off the jobs mark, Bloomberg shows that 824,000 jobs “disappeared” after a birth/death model adjustment in February 2010.  That adjustment is important because if it was known that job creation was weaker by 824,000 jobs during 2009, additional job creation efforts could have been considered. At present job creation is stagnant and we won’t know what role the birth/death model has on today’s job numbers until 2012. But if history is any guide, job creation may again be overstated.  
  1. JOLTS (Job Openings Labor Turnover Survey): This monthly BLS report gives an indication of the number of available jobs. On the occasion that it is mentioned by the media, it offers only a sliver of the issue, such as the number of unemployed per job opening, which stands currently at 4.3.
    From the BLS, “The number of job openings in July was 3.2 million, little changed from June.  Although the number of job openings remained below the 4.4 million openings when the recession began in December 2007, the level in July was 1.1 million openings higher than in July 2009 (the most recent trough). “  
    What is missing from that JOLTS report? Plenty. First, the 4.3 unemployed per job opening is limited to the 14 million U3 unemployed (the 9.1%). But those aren’t the only unemployed wanting a full-time job. There are the 2.6 million marginally attached workers, 8.8 million underemployed (those who want full-time work, but are working part-time). I’m not going to include the 3.9 million non-unemployed unemployed (explained later).  When those 11.4 million workers are included with the 14 million U3 unemployed, there are 25.4 million unemployed workers and 3.2 million available jobs, or 8 unemployed or underemployed workers per 1 job opening.  
    The second issue with JOLTS is that it doesn’t distinguish whether the available jobs are full-time or part-time. According to a BLS representative “Part-time jobs are included in our job openings counts; however, we do not distinguish between full and part-time positions. We only ask if the position exists, not which type of position it is.”  
    It’s important to know how many job openings are part-time, since part-time jobs usually pay less and offer fewer, if any, benefits. Extrapolating from the BLS “Employed persons by class of worker and part-time status” data, there are 139,627,000 employed workers, of which 27,034,000 are part-timers. More than 19% of all workers work part-time. If nearly 20% of all available job openings are part-time, there are only 2.56 million full-time jobs for 25.4 million unemployed and underemployed who want full-time work, or 10 workers for each available full-time position; more than double the 4.3 workers per job opening touted by most media outlets.  
  1. The participation rate: Is, according to the BLS, “The labor force as a percent of the civilian noninstitutional population.” Or, more simply, the percentage of the working-age population that is working or is actively looking for a job. The participation rate rose 0.1 percent in August to 64%, which is slightly above the 27-year low recorded in July of 63.9%.
    If more jobs were available would there be more participation? More than likely that would be the case. The mass media very seldom mentions this point, but the participation rate shows the potential number of people waiting on the sidelines for the job market to improve before they jump back in.  
    A couple of striking graphs of the historical participation rate can be seen at ZeroHedge  and BLS.  

  1. Marginally attached workers:  From the BLS, “These individuals were not in the labor force, wanted and were available for work, and had looked for a job sometime in the prior 12 months. They were not counted as unemployed because they had not searched for work in the 4 weeks preceding the survey.” I know, it’s not an easily digested description, but it’s a population of unemployed that want to work, but for various reasons have not looked for work recently.  Currently 2.6 million workers are considered marginally attached. If they are included in the unemployment rate, that rate increases from 9.1% to 10.6%.
  1. The underemployed: Who are the underemployed? “The number of persons employed part time for economic reasons (sometimes referred to as involuntary part-time workers). These individuals were working part time because their hours had been cut back or because they were unable to find a full-time job,” states the BLS.
    The August employment report indicated that underemployment increased from July by 400,000 to 8.8 million. Part-time jobs range in hours from one to 34, any job of more than 34 hours is considered full-time work. That might not be the case in the real world where a full-time job is considered 40 hours, but that is the case according to the BLS.  
    While some believe that part-time jobs eventually translate into full-time jobs, that hasn’t been the case during this recession, as the linked graph from Calculated Risk illustrates. From 2000 to 2008, the number of underemployed ranged between 3 and 4 million. There are currently 4 million more unemployed than at the start of the recession. Businesses would need to see a dramatic uptick in business to place 4 million more part-timers into full-time slots.  

    The “real” unemployment rate increases to 16.2% when the underemployed and marginally attached workers are considered.  
  1. The not-unemployed unemployed: Yes, there is a point at which the BLS stops considering an unemployed person unemployed. That point is reached when an unemployed person has not look for a job in the previous 12 months. When asked, the BLS replied, “The 3.9 million individuals not in the labor force that you are referring to responded that they wanted a job, but had not looked for a job in the last 12 months. They are not considered unemployed because they had not actively searched for work in the four weeks preceding the survey.” I recall no mention of these 3.9 million from any mass media outlet.
    This 3.9 million are the most discouraged of discouraged workers, but if the jobs market was improving, these millions would start to become part of the unemployed once more. If these 3.9 million were added to the “real” unemployment rate (U6) the rate would increase from 16.2% to 19%. (Which is higher than all but 2 years of the Great Depression's high unemployment rates--jef)
    Nearly one in five American workers is either unemployed or underemployed. Why isn’t that disturbing fact in the media spotlight every day?  
  1. The long-term unemployed: These 6.0 million are the jobless who have been looking for work for 6 months or more (this does not include the not-unemployed unemployed). Long-term unemployment receives occasional mass media recognition, but it scratches only the surface. There are subsets of the long-term unemployed that show the depth of the problem more clearly. The 6.0 million long-term unemployed represent 43.1 percent of all unemployed. Of that 6 million, 4.458 million have been jobless for 52 or more weeks and within that group 2.040 million, a record high, have been unemployed for 99 weeks or more (not to be confused with the “99ers” explained below). Even more startling than those numbers is the lack of response by lawmakers. 
  1. 99ers: These long-term unemployed have exhausted all unemployment benefits (not all unemployed collect unemployment benefits). The name “99ers” comes from the fact that some collected benefits for up to 99 weeks. It’s a misnomer in the sense that only about 25 states are eligible for the 99 week maximum; many unemployed exhausted benefits in as little as 60 weeks.
    Official statistics are not kept for this unemployed population. When Mish Shedlock of Global Economics Trend Analysis was asked about the 99ers population, he contacted Tim Wallace. Wallace has been digging into long-term unemployment data to try and weed out the number of unemployed who have exhausted all unemployment benefits. His most recent efforts show that, “we can safely assume that 3,058,152 people have exhausted all benefits -- they are no longer covered on either sets of (unemployment) rolls.” But it doesn’t end there, using some additional Department of Labor data Wallace pries out another 2.0 million 99ers, for a combined 5.1 million.  
    Other 99ers estimates range from 1.5 to 5.0 million, but as the linked graph at Here come the '99ers at Calculated Risk illustrates; the number of unemployed that are exhausting unemployment benefits is rapidly increasing.  

    While there may be disagreement about the total population of 99ers, Wallace concludes, “There is absolutely NO EXCUSE for this to not be a readily accessible piece of data daily. After all, Walmart can tell you how many strawberry Pop Tarts they sold yesterday.” There is also no excuse for the mass media ignoring this vast unemployed population and not taking agencies to task for not reporting accurate 99ers data.
    Millions of additional unemployed will become 99ers immediately unless extended unemployment benefits are renewed in December. A worker laid off today will be eligible for only 26 weeks of state benefits unless an extension is approved by a much divided Congress.  
  1. How many unemployed collect unemployment benefits? It may seem reasonable to assume that all 14 million unemployed collect unemployment insurance benefits, but that is not the case. In September 7.17 million unemployed collected benefits, which is only 51%  of all unemployed (U3, the 9.1%).
    Surprisingly, on average just one third of all unemployed are eligible for unemployment benefits at the state level (2011 data). As an example, temporary staff, self-employed and recent high school and college graduates may be out of work, but not eligible for benefits. Eligibility rates range from 57 percent in AK and PA to TX at 21 percent. Each state can set its own guidelines regarding eligibility requirements. When someone tells you they are unemployed, it’s more than likely they are not collecting unemployment benefits.  
    Many pundits and some GOP lawmakers excoriate all unemployed for being lazy and enjoying life on the dole. Sen. Jim DeMint (R-SC)recently said, "People are gaming the system and refusing to take jobs because they get unemployment benefits and food stamps." That naïve and cruel assessment disparages all unemployed, but it’s particularly insulting to the majority of unemployed who aren’t eligible to collect or have exhausted unemployment benefits. If Sen. DeMint and his ilk want to see where the system is being gamed, he may want to look at Wall Street instead of Main Street.
What message can be taken from this list of realistic and discomforting unemployment figures? The bottom line is that unemployment is much worse than the 9.1 percent unemployment figure pushed by the media and many lawmakers; in fact it’s considerably worse.

Mass media’s inability to communicate the depth of the jobs crisis is one reason the response to it has been primarily weak and ineffectual. If the media mutes the crisis, lawmakers and corporations will continue to act slowly and impotently, forcing millions of American families to suffer needlessly.

Unemployment and jobs creation are national emergencies demanding focused attention with a wide-ranging and rapid response. This American jobs disaster will not vanish if neglected, but what will vanish are the hopes, dreams and financial well-being of millions of hard-working Americans.

++++++++ 

THE ECONOMY NEEDS 11.2 MILLION JOBS TO REGAIN ITS PRE-RECESSION LEVEL OF UNEMPLOYMENT.
  • In August 2011, the economy added zero (0) jobs. 
  • 17,000 private-sector jobs were created in August 2011; 17,000 public-sector jobs were lost that month. 
  • In August 2011, 366,000 workers entered the labor force. 
  • In August 2011, there were 2.5 million workers who wanted a job, were available to work, but had given up actively seeking work and so were not counted as offi cially unemployed. 
  • In total, there are 6.9 million fewer jobs today than there were in December 2007. 
  • In June 2011, there was only one job opening for every 4.5 unemployed workers in the economy.
THE UNEMPLOYMENT RATE IN AUGUST 2011 WAS 9.1%.
  • There were 14.0 million unemployed workers in August 2011, 6.3 million more than in December 2007. 
  • 42.9% of these unemployed persons have been without a job for more than 6 months. 
  • Males had an unemployment rate of 9.6%, females 8.5%. 
  • Whites had an unemployment rate of 8.0%, blacks 16.7%, and Hispanics 11.3%. 
  • The underemployment rate (i.e., those who are unemployed, marginally attached, or working part time involuntarily) was 16.2% in August 2011. 
  • There were 25.3 million workers who were either unemployed or underemployed in August 2011. 
  • In July 2011, seasonally adjusted underemployment was 25.3% for blacks, 13.2% for whites, and 22.0% for Hispanics.*
IN AUGUST 2011, THERE WERE 11 STATES WITH DOUBLE-DIGIT UNEMPLOYMENT RATES.
  • The state with the highest unemployment rate was Nevada, at 12.9%; the state with the lowest unemployment rate was North Dakota, at 3.3%. 
  • In August 2011, there were 15,000 jobs lost in state and local government; over the last two years, a total of 537,000 state and local jobs have been lost.

THE UNEMPLOYMENT RATE FOR ALL 16-24 YEAR OLDS WAS 17.7% IN AUGUST 2011.
  • The unemployment rate for those 16-24 year olds with a high school diploma (but not currently enrolled in school) was 21.2% in August. 
  • The unemployment rate for those 16-24 year olds with a bachelor’s degree (but not currently enrolled in school) was 11.2% in August. 
  • The unemployment rate for all 16-19 year olds was 25.4% in August; for 16-19 year old blacks it was 46.5%, and for Hispanics it was 37.4%.

SO FAR IN 2011, ANNUALIZED INFLATION-ADJUSTED WAGE GROWTH IN THE PRIVATE SECTOR HAS BEEN -1.6%.
  • Annualized inflation-adjusted growth from 2000 to 2010 for people with a high school diploma was only 0.1%. 
  • Annualized infl ation-adjusted wage growth from 2000 to 2010 for people with a bachelor’s degree was 0.3%. 
  • Annualized productivity growth from 2000 to 2010 in the nonfarm business sector was 2.5%.

IN THE SECOND QUARTER OF 2011, THE ANNUALIZED, INFLATION-ADJUSTED GROWTH RATE OF GROSS DOMESTIC PRODUCT WAS 1.0%.

  • The average infl ation-adjusted rate of GDP growth for the fi rst two quarters of 2011 was 0.7%. 
  • Consumer spending grew at a 0.4% rate in the second quarter of 2011. 
  • The economy, measured in terms of infl ation-adjusted GDP, is currently 0.5% smaller than it was before the recession began in the fourth quarter of 2007.
* This seasonally adjusted underemployment data is calculated by EPI; the most recent data available is from June.