by Robert Oak | The Economic Populist
The press quotes all sorts of figures for the number of monthly job gains needed to keep up with population growth. We see numbers like 80,000, 100,000, 125,000 and 175,000 thrown around like statistical snow as the number of jobs needed each month just to keep up. What's the right one? How many jobs are needed each month just to keep up with population growth?
The actual monthly amount can be calculated and the Atlanta Fed even did us a huge favor by publishing an interactive monthly jobs calculator so you can go check for yourself. This month shows we need 104,116 payroll jobs to maintain the same unemployment rate of 8.1% with all of the other same terrible conditions the state of employment is in.
That's the key, the current terrible conditions the state of employment is in today. One of the reasons the number of jobs to keep up with population growth is so low is due to so many having dropped out of the labor force. If we had more people being counted as needing a job, the number of jobs to keep up with population growth would be much higher.
To explain this, we need to go to BLS school and learn some labor concepts. The employment universe comes from the civilian noninstitutional population. These are people in the United States, aged 16 and over, who aren't in the military, infirmed or locked up somewhere.
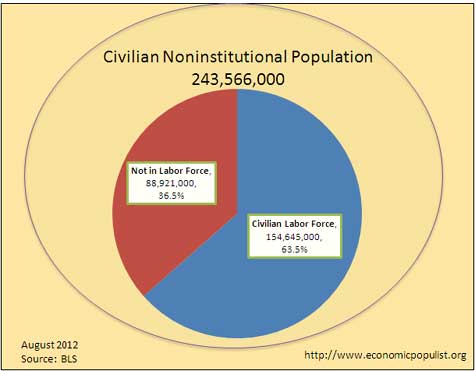
The above pie chart shows how the civilian nonstitutional population is divided up into two classifications, either you're in the civilian labor force, or you're not. The employment statistics come from the civilian labor force. Those who are classified as not in the labor force are not counted, and thus not considered as needing a job or mattering when their numbers swell.
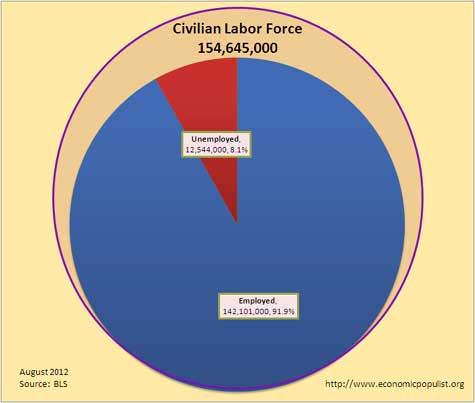
The civilian labor force is then divided up into two categories, either you have a job or you don't. In the unemployed category, you have to be actively looking to be considered as part of the civilian labor force. The above pie chart shows the breakdown, using the August 2012 statistics.
The civilian noninstitutional population grows every month and for 2011, the average was 0.059% per month. For the last 12 months, the average was 0.128% per month, so the population growth varies, but there is a huge problem. The woe is the Census puts their annual benchmark adjustments in the month of January only. The benchmark adjustments are not annually smoothed or averaged in on a month to month basis. This makes the monthly population percentage growth more difficult to estimate, for we have a fudge factor plopped in between the December and January estimates. We can see the annual benchmarks, or fudge factor, in the below graph showing the monthly change in civilian noninstitutional population.
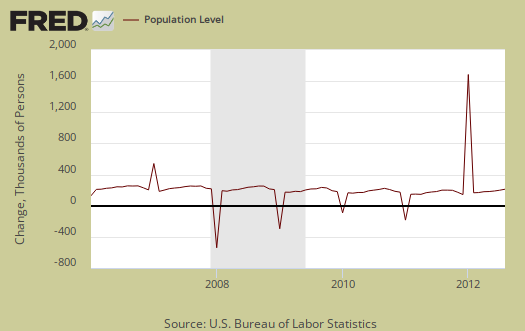
What we can do is ignore the months of January and take the average growth rate for the last year, bypassing the benchmark weirdness month. Doing this gives a monthly growth rate of 0.0762% for noninstitutional civilian population and thus we smooth away those benchmarks to get a much more realistic average population growth rate.
If the fact that the benchmark adjustments are not evenly distributed across the monthly change in noninstitutional civilian population isn't enough to throw a monkey wrench into figuring out how many jobs we need each month just to keep up, we have an additional problem. There are people who really are not in the labor force and these percentages change. The population is getting older, we have more retirees and unfortunately we put people in prison more than any other industrialized nation. Then, other people are not part of the labor force because they have been unemployed so long they are no longer counted. In other words, we cannot say that all of the growth of those not in the labor force is due to people dropping off of the unemployed statistical radar. That said, clearly many are. Where we can see this most is in the labor participation rate. The labor participation rate is the ratio of the civilian labor force to those not in the labor force. The below graph shows we are at record lows in the ratio of those as part of the labor force to those who are not.

If we take the labor participation rate at the start of the great recession, 66%, we get a whole other number of jobs needed each month to keep up with population growth. If we keep the same rate of unemployment, 8.1%, we would need 545,551 jobs per month and it would take an entire year to get to the same August rate of unemployment, 8.1%.
This is because by increasing the labor participation rate 2.5%, we took 6,089,150 people not counted and added them to the labor force statistics and of course, they would enter in as unemployed. The unemployment rate is the ratio of those in the civilian labor force who do not have a job against those who who do.
We can also estimate the number of jobs needed each month, just to maintain, by rough numbers. If we assume a smoothed noninstitutional civilian population growth rate of 0.076% per month, then next month's population growth would be 185,617 additional people ages 16 and over and not locked up somewhere. If we then assume the labor participation rate of this new growth would be 68.0% and not the actual, artificially low 63.5%, we would get an additional 126,920 jobs needed to keep up with this population growth.
This is much more realistic for new population growth is probably going to enter the labor force looking for a job. The BLS counts illegal immigrants, green card holders and foreign guest workers in their statistics and most of the population growth is due to immigration. These people either already have a job upon entering the country, or are going to want one fast. Bottom line, yes Virginia, increased immigration does affect labor markets, all else being static. I do believe to say our economic growth and thus labor demand is static at the moment is not an understatement.
Check out the Atlanta Federal Reserve jobs calculator. It's Economic Populist approved, we checked their arithmetic and assumptions.
If this is not enough to convince you, we suggest reading this article, this or this one for more background.
Finally our favorite and never reported BLS statistic amplifies the terrible situation for labor in this country. The BLS surveys people considered not part of the labor force and asks if they want a job right now. Below is a graph of the people who said yes and watch how this figure swells.
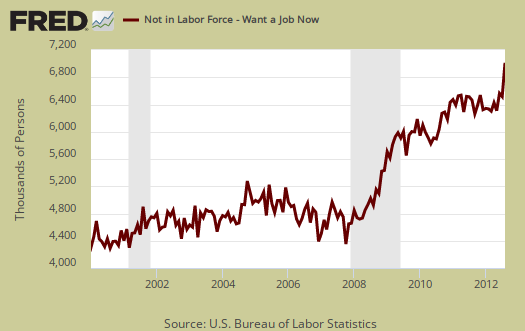
For August 2012, those not counted in the labor force but report they actually want and need a job increased by 403,000 in a month. That, folks, should have you horrified. Literally we have desperate and destitute people falling through the statistical crevasse, into the abyss where they can only shout out from the numerical darkness, yes I want a job!
The press quotes all sorts of figures for the number of monthly job gains needed to keep up with population growth. We see numbers like 80,000, 100,000, 125,000 and 175,000 thrown around like statistical snow as the number of jobs needed each month just to keep up. What's the right one? How many jobs are needed each month just to keep up with population growth?
The actual monthly amount can be calculated and the Atlanta Fed even did us a huge favor by publishing an interactive monthly jobs calculator so you can go check for yourself. This month shows we need 104,116 payroll jobs to maintain the same unemployment rate of 8.1% with all of the other same terrible conditions the state of employment is in.
That's the key, the current terrible conditions the state of employment is in today. One of the reasons the number of jobs to keep up with population growth is so low is due to so many having dropped out of the labor force. If we had more people being counted as needing a job, the number of jobs to keep up with population growth would be much higher.
To explain this, we need to go to BLS school and learn some labor concepts. The employment universe comes from the civilian noninstitutional population. These are people in the United States, aged 16 and over, who aren't in the military, infirmed or locked up somewhere.
The above pie chart shows how the civilian nonstitutional population is divided up into two classifications, either you're in the civilian labor force, or you're not. The employment statistics come from the civilian labor force. Those who are classified as not in the labor force are not counted, and thus not considered as needing a job or mattering when their numbers swell.
The civilian labor force is then divided up into two categories, either you have a job or you don't. In the unemployed category, you have to be actively looking to be considered as part of the civilian labor force. The above pie chart shows the breakdown, using the August 2012 statistics.
The civilian noninstitutional population grows every month and for 2011, the average was 0.059% per month. For the last 12 months, the average was 0.128% per month, so the population growth varies, but there is a huge problem. The woe is the Census puts their annual benchmark adjustments in the month of January only. The benchmark adjustments are not annually smoothed or averaged in on a month to month basis. This makes the monthly population percentage growth more difficult to estimate, for we have a fudge factor plopped in between the December and January estimates. We can see the annual benchmarks, or fudge factor, in the below graph showing the monthly change in civilian noninstitutional population.
What we can do is ignore the months of January and take the average growth rate for the last year, bypassing the benchmark weirdness month. Doing this gives a monthly growth rate of 0.0762% for noninstitutional civilian population and thus we smooth away those benchmarks to get a much more realistic average population growth rate.
If the fact that the benchmark adjustments are not evenly distributed across the monthly change in noninstitutional civilian population isn't enough to throw a monkey wrench into figuring out how many jobs we need each month just to keep up, we have an additional problem. There are people who really are not in the labor force and these percentages change. The population is getting older, we have more retirees and unfortunately we put people in prison more than any other industrialized nation. Then, other people are not part of the labor force because they have been unemployed so long they are no longer counted. In other words, we cannot say that all of the growth of those not in the labor force is due to people dropping off of the unemployed statistical radar. That said, clearly many are. Where we can see this most is in the labor participation rate. The labor participation rate is the ratio of the civilian labor force to those not in the labor force. The below graph shows we are at record lows in the ratio of those as part of the labor force to those who are not.
If we take the labor participation rate at the start of the great recession, 66%, we get a whole other number of jobs needed each month to keep up with population growth. If we keep the same rate of unemployment, 8.1%, we would need 545,551 jobs per month and it would take an entire year to get to the same August rate of unemployment, 8.1%.
This is because by increasing the labor participation rate 2.5%, we took 6,089,150 people not counted and added them to the labor force statistics and of course, they would enter in as unemployed. The unemployment rate is the ratio of those in the civilian labor force who do not have a job against those who who do.
We can also estimate the number of jobs needed each month, just to maintain, by rough numbers. If we assume a smoothed noninstitutional civilian population growth rate of 0.076% per month, then next month's population growth would be 185,617 additional people ages 16 and over and not locked up somewhere. If we then assume the labor participation rate of this new growth would be 68.0% and not the actual, artificially low 63.5%, we would get an additional 126,920 jobs needed to keep up with this population growth.
This is much more realistic for new population growth is probably going to enter the labor force looking for a job. The BLS counts illegal immigrants, green card holders and foreign guest workers in their statistics and most of the population growth is due to immigration. These people either already have a job upon entering the country, or are going to want one fast. Bottom line, yes Virginia, increased immigration does affect labor markets, all else being static. I do believe to say our economic growth and thus labor demand is static at the moment is not an understatement.
Check out the Atlanta Federal Reserve jobs calculator. It's Economic Populist approved, we checked their arithmetic and assumptions.
If this is not enough to convince you, we suggest reading this article, this or this one for more background.
Finally our favorite and never reported BLS statistic amplifies the terrible situation for labor in this country. The BLS surveys people considered not part of the labor force and asks if they want a job right now. Below is a graph of the people who said yes and watch how this figure swells.
For August 2012, those not counted in the labor force but report they actually want and need a job increased by 403,000 in a month. That, folks, should have you horrified. Literally we have desperate and destitute people falling through the statistical crevasse, into the abyss where they can only shout out from the numerical darkness, yes I want a job!
No comments:
Post a Comment