An interactive map of how every story in the news is related, updated daily.
By Chris Wilson
Like Kevin Bacon's co-stars, topics in the news are all connected by degrees of separation. To examine how every story fits together, News Dots visualizes the most recent topics in the news as a giant social network. Subjects—represented by the circles below—are connected to one another if they appear together in at least two stories, and the size of the dot is proportional to the total number of times the subject is mentioned.
To use this interactive tool, just click on a circle to see which stories mention that topic and which other topics it connects to in the network. Double click a dot to zoom in on it. From there, you can click on any connected dot to see which stories mention both subjects. To zoom out, just double click in white space or use the zoom out button in the upper left corner. The buttons in the upper right can toggle the emphasis between the importance of a subject and how recently it has appeared on the radar. A more detailed explanation of how News Dots works is available below the graphic.
This is a work in progress, so please send us your ideas for features you'd like to see or other ways we can improve it.
How News Dots works
Step 1: Behind the scenes, News Dots scans all articles from major publications—about 500 stories a day—and submits them to Calais, a service from Thompson Reuters that automatically "tags" content with all the important keywords: people, places, companies, topics, and so forth. Slate's tool registers any tag that appears at least twice in a story.
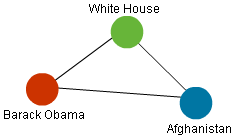
Step 2: Each time two tags appear in the same story, this tool tallies a connection between them. For example, a story about a planned troop increase in Afghanistan reform might return tags for President Obama, the White House, and Afghanistan. These topics are now connected:
Step 3: As this tool scans hundreds of stories, this network grows rapidly, and "communities" begin to form among the tags. Subjects that are highly connected—those that appear together in many stories—cluster together in the network. This occurs in the same way that a picture of the social network of your Facebook friends would reveal clusters of friends from high school, college, and work, with some unexpected connections between them when friends belong to multiple cliques.
Step 4: The news network that results is visualized using Slate's custom News Dots tool, which is built using an open-source Actionscript library called Flare. Tags are displayed if they appear in at least four stories, and connections are made if at least two stories link those two subjects. The visualization covers the previous three days of news and is updated daily.
No comments:
Post a Comment