Friday, May 4, 2012 by Common Dreams
Employment data released today from the Bureau of Labor Statistics show that 12.5 million people were "officially" unemployed in April (while more accurate, "unofficial" totals reach figures of 26 million+--even as high as 85 million).
The U3 "official" unemployment rate was at 8.1 percent, barely down from March's 8.2%. The more accurate but still incomplete U6 unemployment rate was at 14.5%.
Economist Dean Baker notes that the fall in unemployment is due entirely to people leaving the workforce and adds: "It is virtually certain that the unemployment rate will rise in coming months."
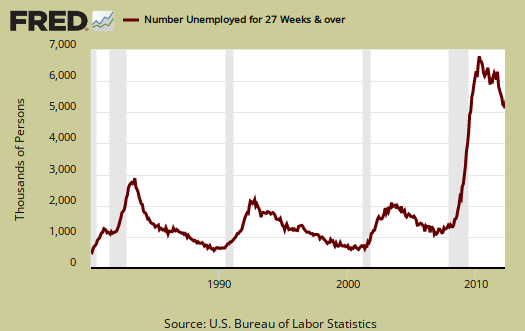
41.3 percent of the unemployed in April have been jobless for 27 weeks or more.
Economist Chad Stone of the Center on Budget and Policy Priorities writes:
CBPP Statement: Chad Stone, Chief Economist, on the April Employment Report
Critics of the BLS labor market data argue that the extent of unemployment is understated in the BLS announcements. To fully understand the current "employment situation," you have to look at the history.
A note about the marginally attached, workers "Among the marginally attached, there were 865,000 discouraged workers in March, about the same as a year earlier. (The data are not seasonally adjusted.) Discouraged workers are persons not currently looking for work because they believe no jobs are available for them. The remaining 1.5 million persons marginally attached to the labor force in March had not searched for work in the 4 weeks preceding the survey for reasons such as school attendance or family responsibilities."

Alternative Unemployment Rate is 16.6% and Other Scary Unemployment Statistics
The U3 "official" unemployment rate was at 8.1 percent, barely down from March's 8.2%. The more accurate but still incomplete U6 unemployment rate was at 14.5%.
Economist Dean Baker notes that the fall in unemployment is due entirely to people leaving the workforce and adds: "It is virtually certain that the unemployment rate will rise in coming months."
41.3 percent of the unemployed in April have been jobless for 27 weeks or more.
Economist Chad Stone of the Center on Budget and Policy Priorities writes:
"Though unemployed and underemployed workers bear the brunt of a long economic slump like the one we‘re experiencing, the economy’s long-term growth prospects are hurt as well. That should weigh more heavily than it apparently does in policymakers’ deliberations over how quickly to reduce budget deficits and how to achieve the Federal Reserve’s dual mandate to keep inflation in check (it is right now) and to promote strong economic growth and employment (both of which are weak)."
* * *
Dean Baker: Job Slowdown Continues into April, but Unemployment Still Edges DownwardIt is virtually certain that the unemployment rate will rise in coming months.
The economy added just 115,000 jobs in April. While the March number was revised up to 154,000, the 135,000 two-month average is well below the 252,000 average for the prior three months. Clearly much of this story is bounce back, where the unusually good winter weather brought much hiring forward.
In spite of the slower job growth, the unemployment rate edged down again to 8.1 percent. However, this is not a case of the household survey showing a different picture than the establishment survey. As was the case last month, the drop in unemployment was entirely attributable to people leaving the labor force. The employment-to-population ratio (EPOP) fell by 0.1 percentage points for the second consecutive month, to 58.4 percent. This is just 0.3 percentage points above the low for the downturn.
There are few sectors in the establishment survey that have shown much strength over the last two months. In the clearest case of a weather effect, construction employment has edged down by 6,000 since January after increasing 44,000 from November to January. The general trend may be upward here, but very slowly. It is worth noting that unemployment among workers in the construction industry fell to 14.5 percent in April, implying they added just 0.2 percentage points to overall unemployment.
Manufacturing added 16,000 jobs in April, almost all in durable goods. Over the last five months, job growth in the sector has averaged 35,000 per month. The health care sector added 19,000 jobs in April, slightly less than its 27,000 average over the last year. The restaurant sector added 19,700 jobs, slightly higher than the 15,000 average over the last year.
The employment services sector added 21,100 jobs in April, but much of this was reversing a loss of 9,400 jobs in March. There was a similar story in retail, which added 29,300 jobs in April after losing 20,900 (both mostly in department stores) in March. Both sectors are showing erratic movements, but not much growth.
The government sector lost 15,000 jobs in April, slightly less than the 18,000 average loss over the last year. (The March gain was revised to show a loss of 12,000 jobs.) Local education accounted for 10,700 of the lost jobs. There was an anomalous decline of 11,000 jobs in passenger and ground transportation. This will likely be reversed.
It's worth noting that 93.1 percent of the private sector jobs created over the last year were classified as production non-supervisory jobs. This compares to 82.4 percent of jobs falling in this category last year. These are generally thought to be less-skilled positions. This implies that job growth is most rapid at the middle and bottom of the labor force right now, rather than at the top, as many have claimed.
There is not much positive in the household survey. The survey shows a drop in employment of 200,000 since February. This is almost certainly just an erratic movement in the data, but the pattern in EPOPs is more consistent with the job growth numbers in the establishment survey than the sharp drop in the unemployment rate. The economy needs 125,000 jobs a month to keep pace with labor force growth; the 1.8 million jobs created last year would not be expected to lead to a fall of 0.9 percentage points in the unemployment rate.
By demographic group, the worst story is among black men and black teens. The former has an EPOP that is 6.5 percentage points below its pre-recession level.
Black teens have an EPOP of 15.5 percent, down 9.0 percentage points from the 2006 level. The EPOP for black women is down 3.7 percentage points from its pre-recession level, but has risen 3.2 percentage points from lows hit last summer.
The EPOP for white men is 4.8 percentage points below the pre-recession level, but up 0.6 percentage points from last summer's low. The EPOP for white women is 3.0 percentage points below its pre-recession level, but hit a new low in April.
The economy is not growing fast enough to bring unemployment down quickly or to any real positive effect.
* * *
Today’s employment report shows that April’s job growth was disappointing for the second straight month and that the economic costs in terms of fewer jobs, less income, and lower growth remain very high. In particular, the number of workers in the Labor Department’s broadest measure of labor market underutilization — comprising the unemployed, discouraged workers and others “marginally attached” to the labor force who nonetheless have indicated they want to work, and people working part-time for economic reasons — stands at roughly 23 million. That’s much higher than at the start of the recession or, before that, than any time for which we have available data, dating back to 1994 (see chart). [...]
The economy is operating well below its full productive capacity, with a substantial shortfall in jobs, production, and income. And, as the Congressional Budget Office (CBO) notes, the costs “fall disproportionately on people who lose their jobs, who are displaced from their homes, or who own businesses that fail.”
* * *
Critics of the BLS labor market data argue that the extent of unemployment is understated in the BLS announcements. To fully understand the current "employment situation," you have to look at the history.
- Many people who were once in the labor force are no longer seeking work. The BLS reported, "The civilian labor force participation rate (63.8 percent) and the employment-population ratio (58.5 percent) were little changed in March." Until the end of 2008, the labor force participation rate had consistently been over 66 percent for the previous 20 years. The employment-population ratio had been between 62 and 64 percent since 1993.
- The BLS also reported, "The number of persons employed part time for economic reasons (sometimes referred to as involuntary part-time workers) fell from 8.1 to 7.7 million over the month. These individuals were working part time because their hours had been cut back or because they were unable to find a full-time job."
- Some people have simply given-up looking for jobs. The BLS reported, "In March, 2.4 million persons were marginally attached to the labor force, essentially unchanged from a year earlier. (The data are not seasonally adjusted.) These individuals were not in the labor force, wanted and were available for work, and had looked for a job sometime in the prior 12 months. They were not counted as unemployed because they had not searched for work in the 4 weeks preceding the survey.
A note about the marginally attached, workers "Among the marginally attached, there were 865,000 discouraged workers in March, about the same as a year earlier. (The data are not seasonally adjusted.) Discouraged workers are persons not currently looking for work because they believe no jobs are available for them. The remaining 1.5 million persons marginally attached to the labor force in March had not searched for work in the 4 weeks preceding the survey for reasons such as school attendance or family responsibilities."

* * *
Alternative Unemployment Rate is 16.6% and Other Scary Unemployment Statistics
Submitted by Robert Oak on Fri, 05/04/2012
April brings showers and yet another sad employment report.
The new official unemployed tally is 12,500,000 with an unemployment
rate of 8.1%. We calculate below an alternative unemployment rate of 16.62%, which shows 26.72 million people need a full-time, real job.
First, the average length of unemployment is still very high, 39.1 weeks, even while dropping 0.3 percentage points from last month.

People unemployed for 27 weeks or more is now 41.3% of the total unemployed, or 5,101,000 million and a seasonally adjusted drop of -207,000 from last month. This percentage has barely budged as a percentage of total unemployed in comparison to pre-recession and historical levels.
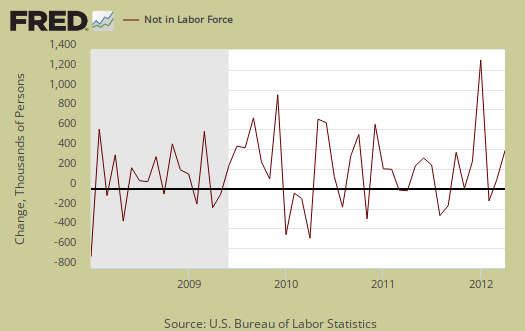
The above drop in long term unemployed by -207,000 appears to imply these people just dropped off of the count. Those not counted, or people in the civilian, non-instutionalized, adult population who are considered not in the labor force, increased by over half a million in a month, or 522,000, to stand at 88,419,000. The civilian non-institutional population is currently 242,784,000. Below is the monthly change of those considered not in the labor force. This is a statistically noisy figure on a month to month basis and that super large spike in January 2012 are the 2010 Census adjustments. See this post for details on those adjustments and this one for affects and data continuity.
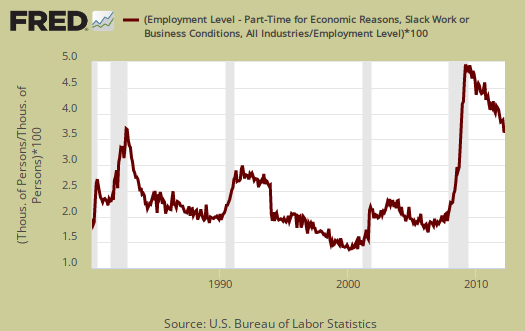
Some people are in part-time jobs because they want to be, others because they cannot find anything else. Some are stuck in part-time because their hours were cut by their employer. These part-timers due to slack work now number 5,187,000, an uptick of 106,000 from March.
Below is a graph of forced part-time because they got their hours cut as a percentage of the total employed. If you want to see a recession economic indicator, this looks like a pretty damn strong one. See how closely the percentage increase matches recessions, the gray bars? The percentage of people in part-time jobs due to slack economic conditions has stayed extremely high since the start of the Great Recession, even while declining. An uptick of any size is simply something we do not want to see.
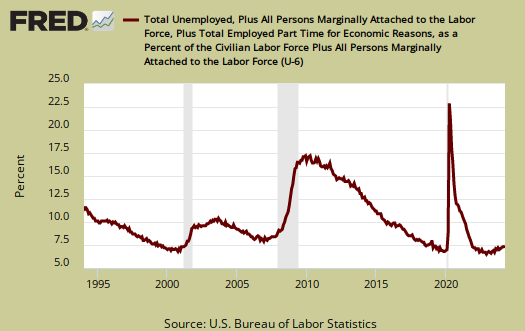
U-6 is a broader measure of unemployment, includes the official unemployed, people stuck in part-time jobs and a subgroup not counted in the labor force but are available for work and looked in the last 12 months. U-6 has also remained consistently high. In February U-6 was 14.5%, the same as March's U-6 alternative unemployment rate.
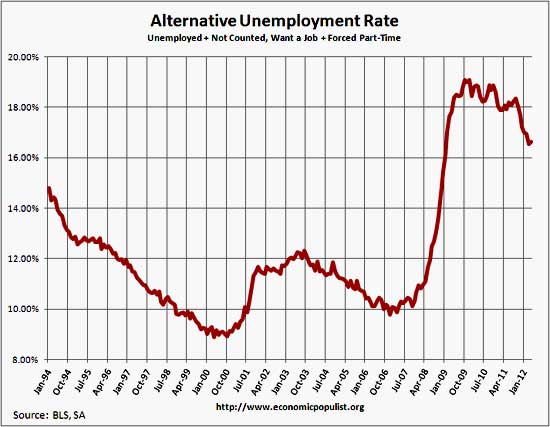
The real number of people wanting a job for April is 26.72 million, over double the official counted as unemployed of 12.5 million. One needs to add up the official unemployed, people stuck in part-time who need full-time jobs, and all of those people not in the labor force, but who report they actually want a job, currently at 6.366 million.

This gives an unemployment rate of 16.62%, calculated following the methods from this article on estimating the real unemployment numbers. March's alternative unemployment rate was 16.55%.
Another indicator things are not so rosy is the number of discouraged workers remains highly elevated. Discouraged workers are people, not counted as part of the civilian labor force, who not only want a job, but also looked for one in the last year. These people aren't job hunting now because they believe there are no jobs out there. Below is the graph of discouraged workers, currently at 0.968 million.

A final area of contention is figuring out how many jobs are needed each month to keep up with population growth. Seems many in the press just throw out a number. We just don't know due to civilian non-institutional population fluctuation. We do know that overall population monthly growth has been hovering around 200,000 a month, this month the change was 180,000. We also know the civilian non-institutional population is roughly 75% of the total population. We also know the labor participation rates and employment to population ratios are artificially low. Therefore, it's safe to say we need about 100,000 jobs per month to keep up with population growth at these same record low labor participation rates. The Atlanta Fed got sick of the debate it seems and put up a monthly jobs calculator. Appears 100,000 is right on the money for the monthly jobs needed to keep up with population growth, 101,169 in fact. We've checked the Atlanta Fed's job calculator, it is correct, using the same methods we have done on this site, by hand.
Long-Term Unemployment a Problem That Won't Go Away
Even groups with relatively low unemployment rates have high levels of long-term joblessness.
First, the average length of unemployment is still very high, 39.1 weeks, even while dropping 0.3 percentage points from last month.
People unemployed for 27 weeks or more is now 41.3% of the total unemployed, or 5,101,000 million and a seasonally adjusted drop of -207,000 from last month. This percentage has barely budged as a percentage of total unemployed in comparison to pre-recession and historical levels.
The above drop in long term unemployed by -207,000 appears to imply these people just dropped off of the count. Those not counted, or people in the civilian, non-instutionalized, adult population who are considered not in the labor force, increased by over half a million in a month, or 522,000, to stand at 88,419,000. The civilian non-institutional population is currently 242,784,000. Below is the monthly change of those considered not in the labor force. This is a statistically noisy figure on a month to month basis and that super large spike in January 2012 are the 2010 Census adjustments. See this post for details on those adjustments and this one for affects and data continuity.
Some people are in part-time jobs because they want to be, others because they cannot find anything else. Some are stuck in part-time because their hours were cut by their employer. These part-timers due to slack work now number 5,187,000, an uptick of 106,000 from March.
Below is a graph of forced part-time because they got their hours cut as a percentage of the total employed. If you want to see a recession economic indicator, this looks like a pretty damn strong one. See how closely the percentage increase matches recessions, the gray bars? The percentage of people in part-time jobs due to slack economic conditions has stayed extremely high since the start of the Great Recession, even while declining. An uptick of any size is simply something we do not want to see.
U-6 is a broader measure of unemployment, includes the official unemployed, people stuck in part-time jobs and a subgroup not counted in the labor force but are available for work and looked in the last 12 months. U-6 has also remained consistently high. In February U-6 was 14.5%, the same as March's U-6 alternative unemployment rate.
The real number of people wanting a job for April is 26.72 million, over double the official counted as unemployed of 12.5 million. One needs to add up the official unemployed, people stuck in part-time who need full-time jobs, and all of those people not in the labor force, but who report they actually want a job, currently at 6.366 million.
This gives an unemployment rate of 16.62%, calculated following the methods from this article on estimating the real unemployment numbers. March's alternative unemployment rate was 16.55%.
Another indicator things are not so rosy is the number of discouraged workers remains highly elevated. Discouraged workers are people, not counted as part of the civilian labor force, who not only want a job, but also looked for one in the last year. These people aren't job hunting now because they believe there are no jobs out there. Below is the graph of discouraged workers, currently at 0.968 million.
A final area of contention is figuring out how many jobs are needed each month to keep up with population growth. Seems many in the press just throw out a number. We just don't know due to civilian non-institutional population fluctuation. We do know that overall population monthly growth has been hovering around 200,000 a month, this month the change was 180,000. We also know the civilian non-institutional population is roughly 75% of the total population. We also know the labor participation rates and employment to population ratios are artificially low. Therefore, it's safe to say we need about 100,000 jobs per month to keep up with population growth at these same record low labor participation rates. The Atlanta Fed got sick of the debate it seems and put up a monthly jobs calculator. Appears 100,000 is right on the money for the monthly jobs needed to keep up with population growth, 101,169 in fact. We've checked the Atlanta Fed's job calculator, it is correct, using the same methods we have done on this site, by hand.
* * *
Long-Term Unemployment a Problem That Won't Go Away
Even groups with relatively low unemployment rates have high levels of long-term joblessness.
The U.S. economy has added jobs for 18 straight months, but
those jobs continue to bypass some of the people who need them most,
according to new research.
In the first quarter of 2012, nearly 30 percent of the 13.3 million unemployed Americans had been jobless for over a year, according to a Pew Charitable Trusts analysis of Labor Department data. That figure is starting to tick downward but remains remarkably high. At its peak in the third quarter of 2011, 31.8 percent of workers had been jobless for a year or more. However, the figure was much lower at the start of the recession.
"When you look at the overall long-term unemployment rate in early 2008, it was about 9.5 percent," says Ingrid Schroeder, director of the Pew Fiscal Analysis Initiative at the Pew Charitable Trusts. "And when you look at where we are today, at 29.5 percent, you expect it to be worse [than where it was at the beginning of the recession], but it's more than triple where it was at the beginning of the Great Recession."
The data complicates the picture of joblessness in the U.S. It is by now widely known that younger people are less employed than older people and that higher education levels correlate with lower jobless rates. While that remains true, the patterns for longer-term unemployment don't follow those patterns.
For example, while unemployment for older workers is far lower than for younger age groups—6.8 percent of the labor force over 55 was unemployed in the first quarter, compared to 23.5 percent for people under 20 and 14.2 percent for those age 20-24—those older workers who are out of work are less likely than younger workers to be rehired, and therefore can stay on the unemployment rolls far longer.
As of the first quarter of 2012, nearly 44 percent of unemployed workers over 55 had been jobless for a year or longer. That share of longer-term unemployed people shrinks as one moves further down the age spectrum. Among workers aged 20 to 24, only 21.4 percent had been unemployed for a year or more, and among workers under 20, that share is 12.1 percent.
Likewise, while education can reduce the risk of joblessness, it does not protect against long-term unemployment, notes Schroeder.
"Although people with higher degrees are less likely to become unemployed in the first place, they're just as likely as other education groups to stay unemployed for a long period of time," she says.
More education makes for less unemployment—14.1 percent of the labor force with less than a high school diploma was unemployed last quarter, compared to 3.3 percent for people with an advanced degree. However, in both of those categories, as well as for high school and college grads and people with some college, roughly one-third of the jobless had been unemployed for more than a year, ranging from 29.7 percent for those with less than a high school education to 35.6 percent for those with some college.
For those who have been out of work for over a year, the ramifications of prolonged unemployment can be profound. Being out of work for an extended period of time causes what some call "unemployment scarring," making a candidate less attractive to an employer, who may fear a loss of job skills. Likewise, it can make for depressed future wages for that worker, says Schroeder.
And the problem will take a long time to heal. While the unemployment rate is a lagging indicator, the recovery in long-term unemployment is lagging even further behind.
"Long-term unemployment numbers are showing some slight improvement, but it's persistent," says Schroeder. "This problem is not recovering as quickly even as the regular unemployment numbers are. Long-term unemployment is this nagging thing that's still there."
No comments:
Post a Comment